
Holoepipelagic (Organism)........................................................................................................................Holoépipélagique (Organisme)
Holoepipelágico / Holoepipelágico (organismo) / Holoepipelagic (immer in der epipelagic Zone) / holoepipelagic(总是,在epipelagic区) / Голоэпипелагический (организм) / Holoepipelagic (sempre nella zona epipelagica) /
Organism, usually, a fish, which lives permanently in the epipelagic zone.
See: « Pelagic (organism) »
&
« Epi-pelagic (zone) »
&
« Epi-fauna »
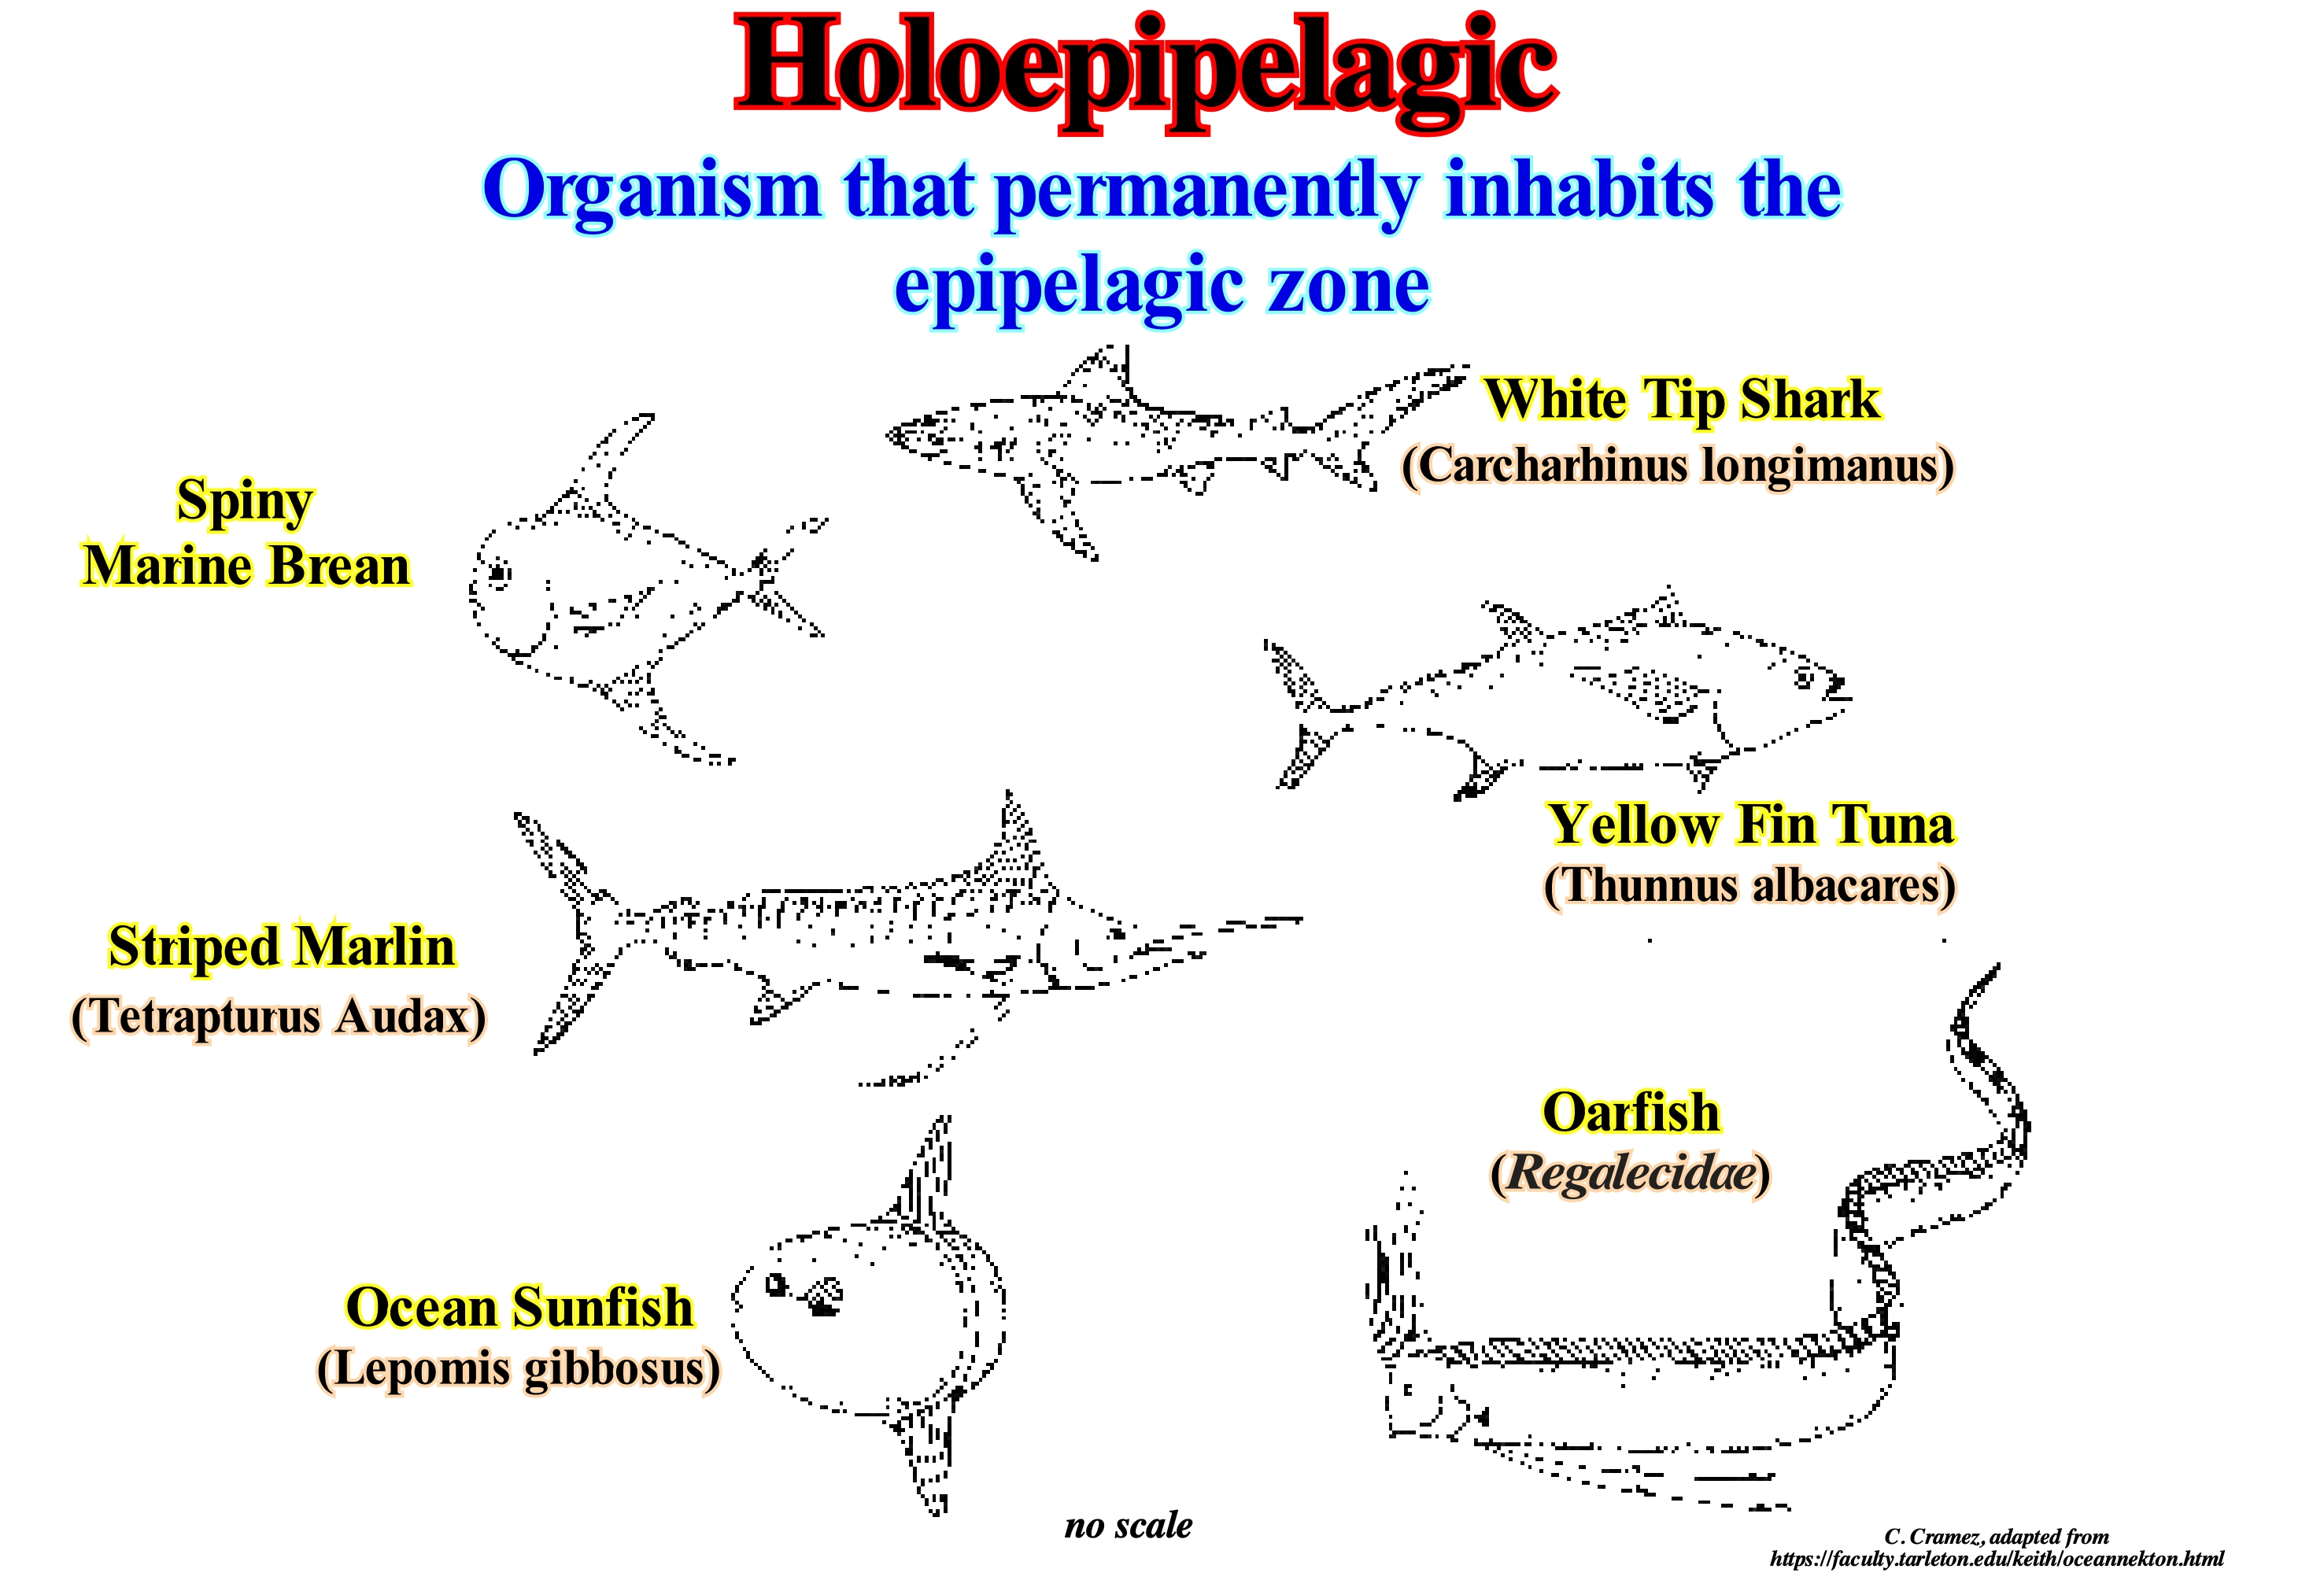
The nekton consists of good swimmers, i.e., by organisms that do not depend on the marine currents to move. Nekton is, predominantly, made up of vertebrates. Fish are by far the most numerous, but each class of vertebrates, except amphibians are represented in the nekton. The oceanic nekton is distributed in the, relatively, shallow-water zone. Oceanic nekton is composed of a wide variety of bony fish, sharks, rays, and, to a lesser extent, mammals and reptiles. The only invertebrates that can be considered as nekton are the cephalopods molluscs. Fish that spend their lives in epipelagic environments are called holoepipelagic. Among them, as illustrated in this figure, there may be mentioned, for example: white tip sharks, sea bream, yellow-fin tuna, striated swordfish, needle-fish, sunfish, etc. The second group of oceanic fish is called meroepipelagic. These fish spend only part of their life in the epipelagic zone. This is a more diverse group and includes fish that spend their adult lives in epipelagic environments, but spawn in coastal waters (such as herring, whale shark, dolphin, etc.) or fresh-water (salmon). Another component of oceanic nekton are marine mammals. Among them are whales (order of cetaceans), seals and sea lions (order Carnivora). Other marine mammals including manatees and dugongs (Sirenia order) and sea otters (Carnivora order), but these occupy the coastal waters. Oceanic nektonic reptiles are almost, exclusively, turtles and snakes. There are also marine iguanas in the Galapagos Islands and marine crocodiles around some islands in Indonesia and Australia, but these reptiles are coastal and coastal animals. Many of the organisms that form oceanic ocean are, perfectly, adapted to the aquatic environment. Other ways such as bone reduction and the presence of a layer of lipids (fats and oils) are used by marine mammals to increase buoyancy. Large amounts of lipids are also present in nektonic fish that do not have swim bladders (sharks, mackerels, bonito). Besides these means of producing buoyancy, some nektonic animals have hydrodynamic mechanisms for the production of buoyancy during movement.
Holoplankton.......................................................................................................................................................................................................Holoplancton
Holoplâncton / Holoplancton / Holoplankton / 终生浮游生物 / Голопланктон / Holoplankton /
Organisms that are planktonic all their life, like, diatoms, radiolarians, dinoflagellates, etc.
See: « Plankton »
&
« Benthos »
&
« Mega-plankton »
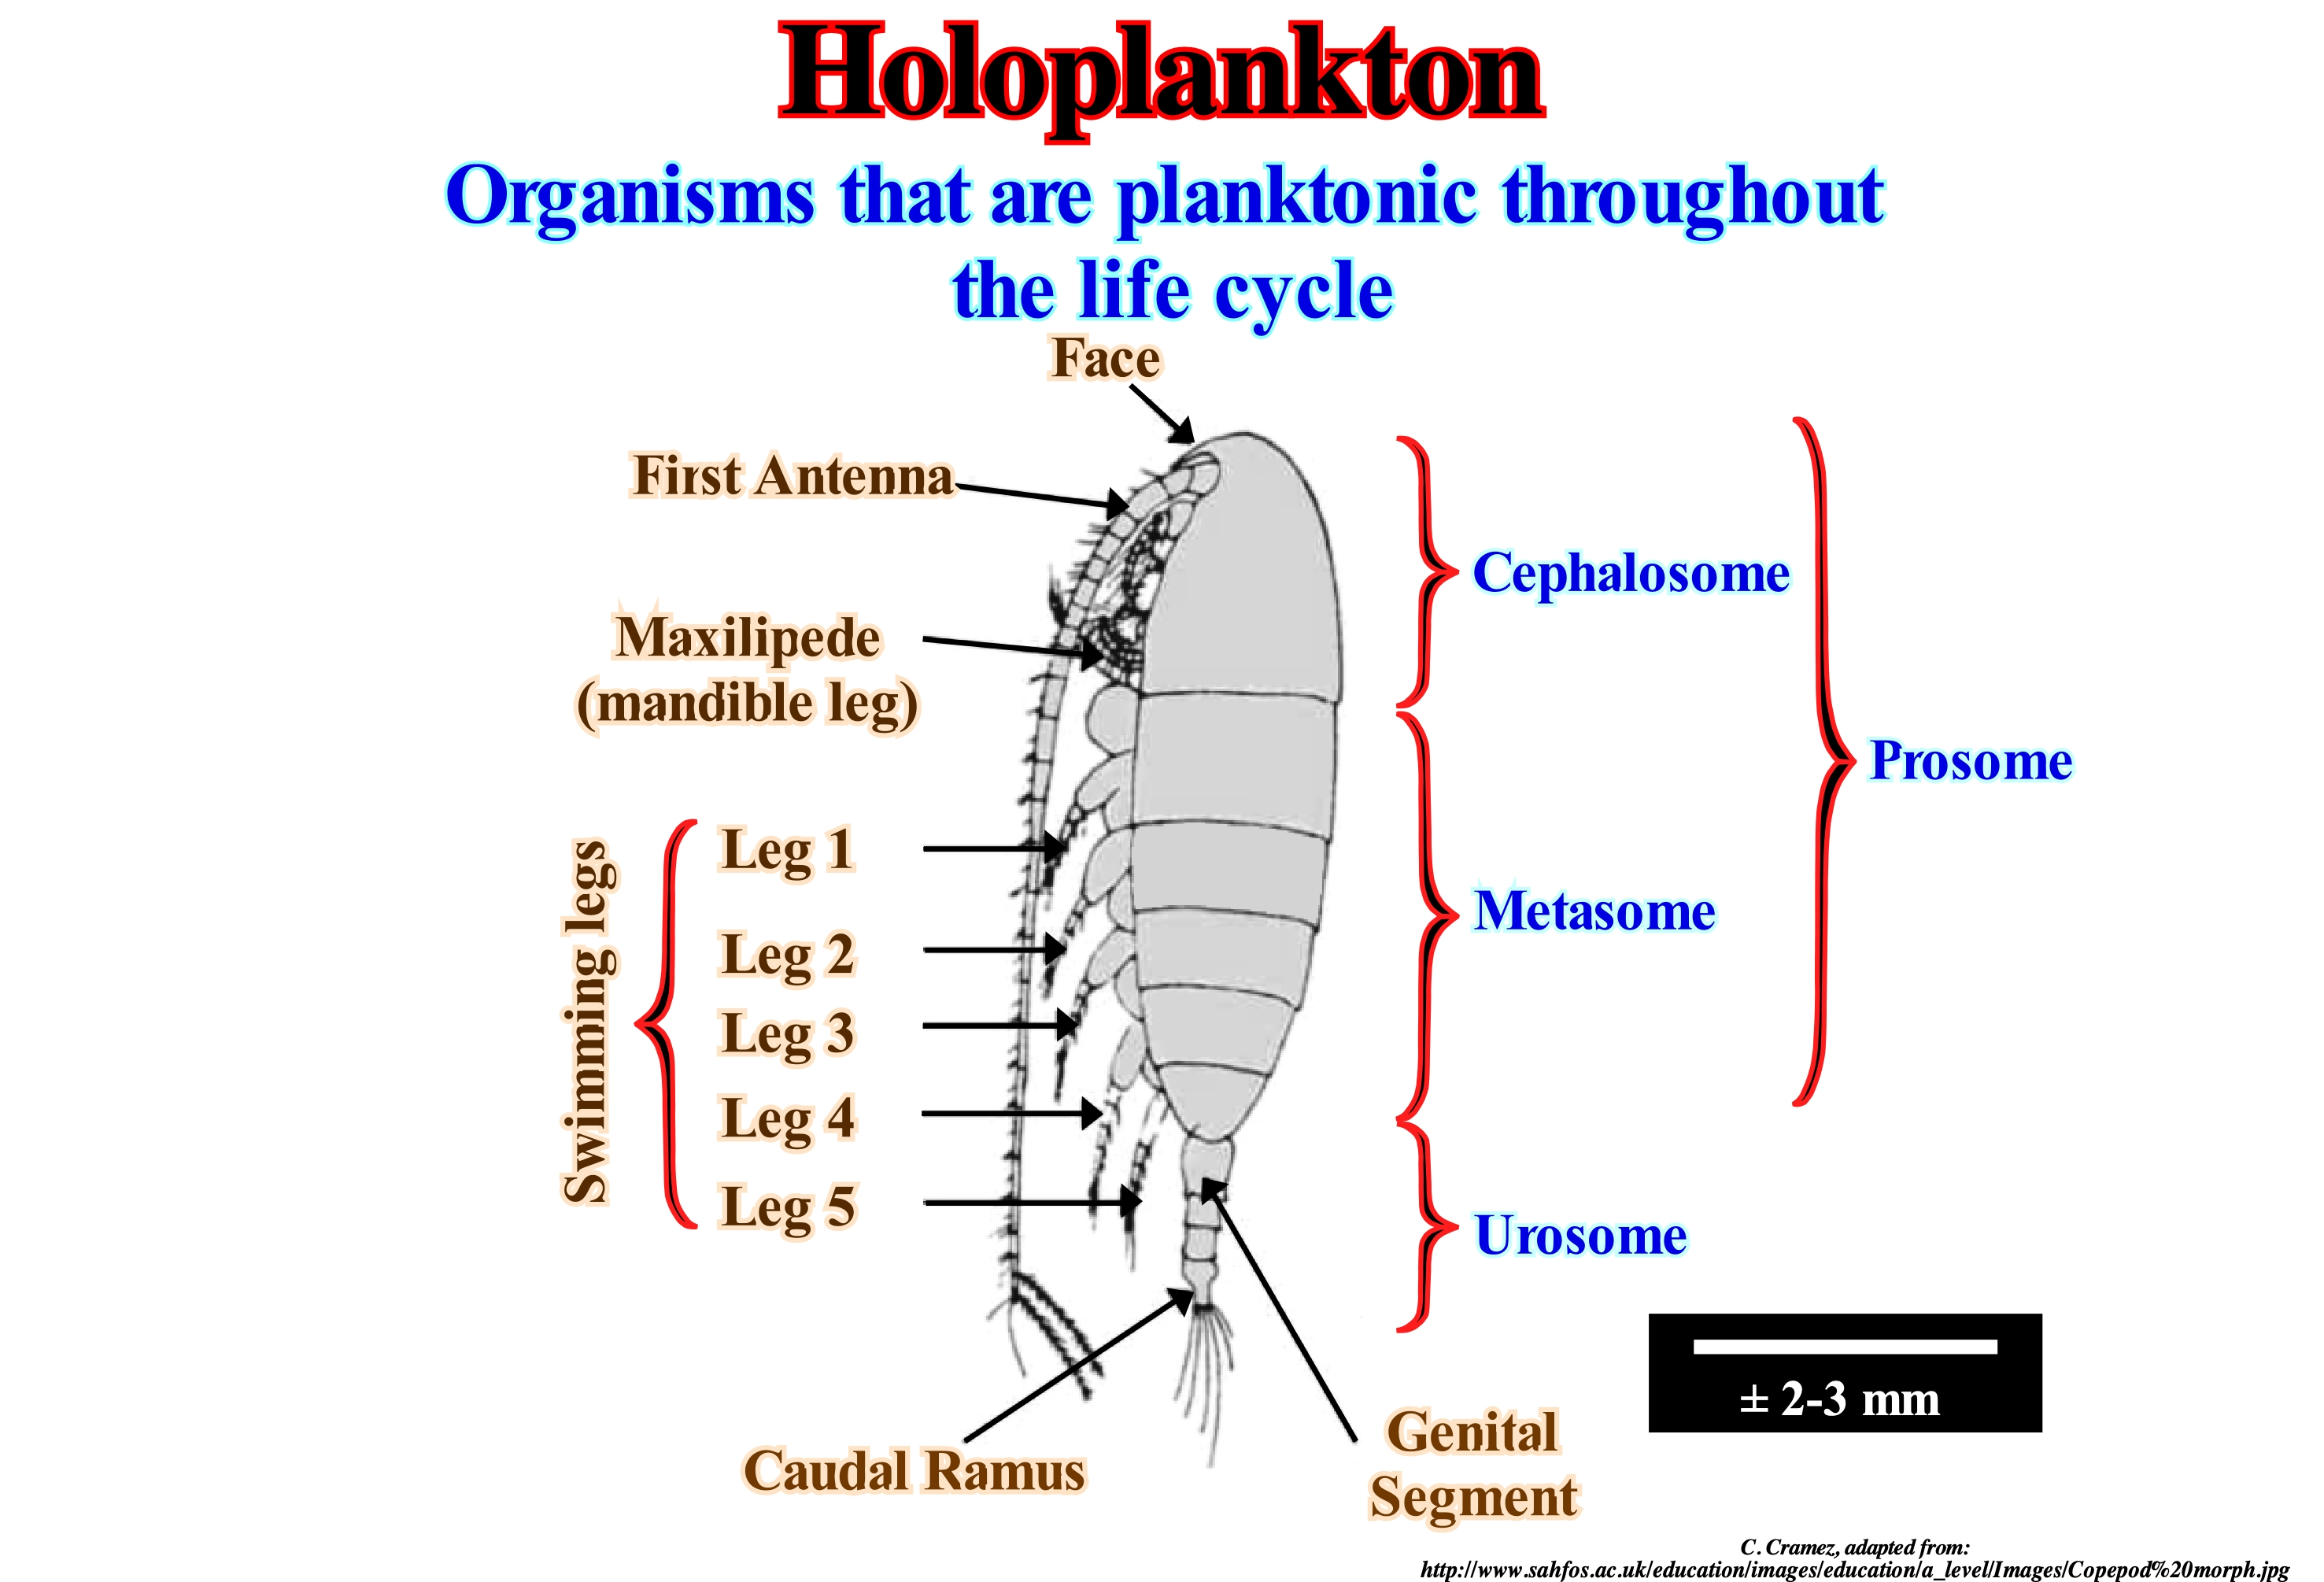
Holo-plankton is a part of animal plankton or zoo-plankton. It is called holoplankton or true plankton to the bodies that remain in the state of plankton throughout its life cycle. It is contrasted with meroplankton or temporary plankton, which is composed of organisms that spend only part of their lives, usually, the larval state, in the form of plankton (jellyfish, crustaceans, larvae, worms, etc.). The holo-plankton consists mainly of micro-algae, unicellular animals and some crustaceans such as copepods, which account for about 70% of zoo-plankton. Copepods, as illustrated in this figure, are free living planktonic organisms (similar to a small cochineal, variety of aphids) ranging from 1 to 10 millimetres in length. They are able to move freely, at small distances, by shaking the articulated members and antennae. This is interpreted as being a mechanism to prevent predators. Their antennae also help prevent them from sinking through the water column. There are thousands of species of copepods that form the holo-plankton. Some live in fresh-water, but most are marine organisms, which have a basic morphology. Copepods are, probably, the most abundant multicellular organisms on Earth. Some authors think that there are about 11,500 species of copepods divided into approximately 200 families and 1,650 genera. Copepods are a diverse group and although some are carnivorous or omnivorous, most are herbivores feeding on phyto-plankton. They feed themselves through a filtration system or using the appendices to manipulate the cell. The emergence of copepods populations throughout the year affects phyto-plankton cycles in the ocean. In the holo-plankton are also cnidarians (aquatic animals known as coelenterates, such as fresh-water hydra, jellyfish, jellyfish, corals, sea anemones and caravels), chaetognatha or bristle-jaws (small marine animals about 15 cm length, elongated and non-segmented body with lateral fins and caudal fins that are extensions of the ectoderm), ostracods (small crustaceans with a limestone shell, composed of two leaflets that are articulated through a structure called a hinge, located in the region dorsal of the animal), etc.
Hollow (Wave trough).........................................................................................................................................................................................................Creux (Onde)
Cava (onda) / Depresión / Wellental / 空心 / Впадина (прогиб) / Cavo/
Concave sector of a wave (disturbance that transfers energy through matter or space, with little or no associated mass transport).
See: « Wave-length »
&
« Fair Weather Wave Base »
&
« Fetch »
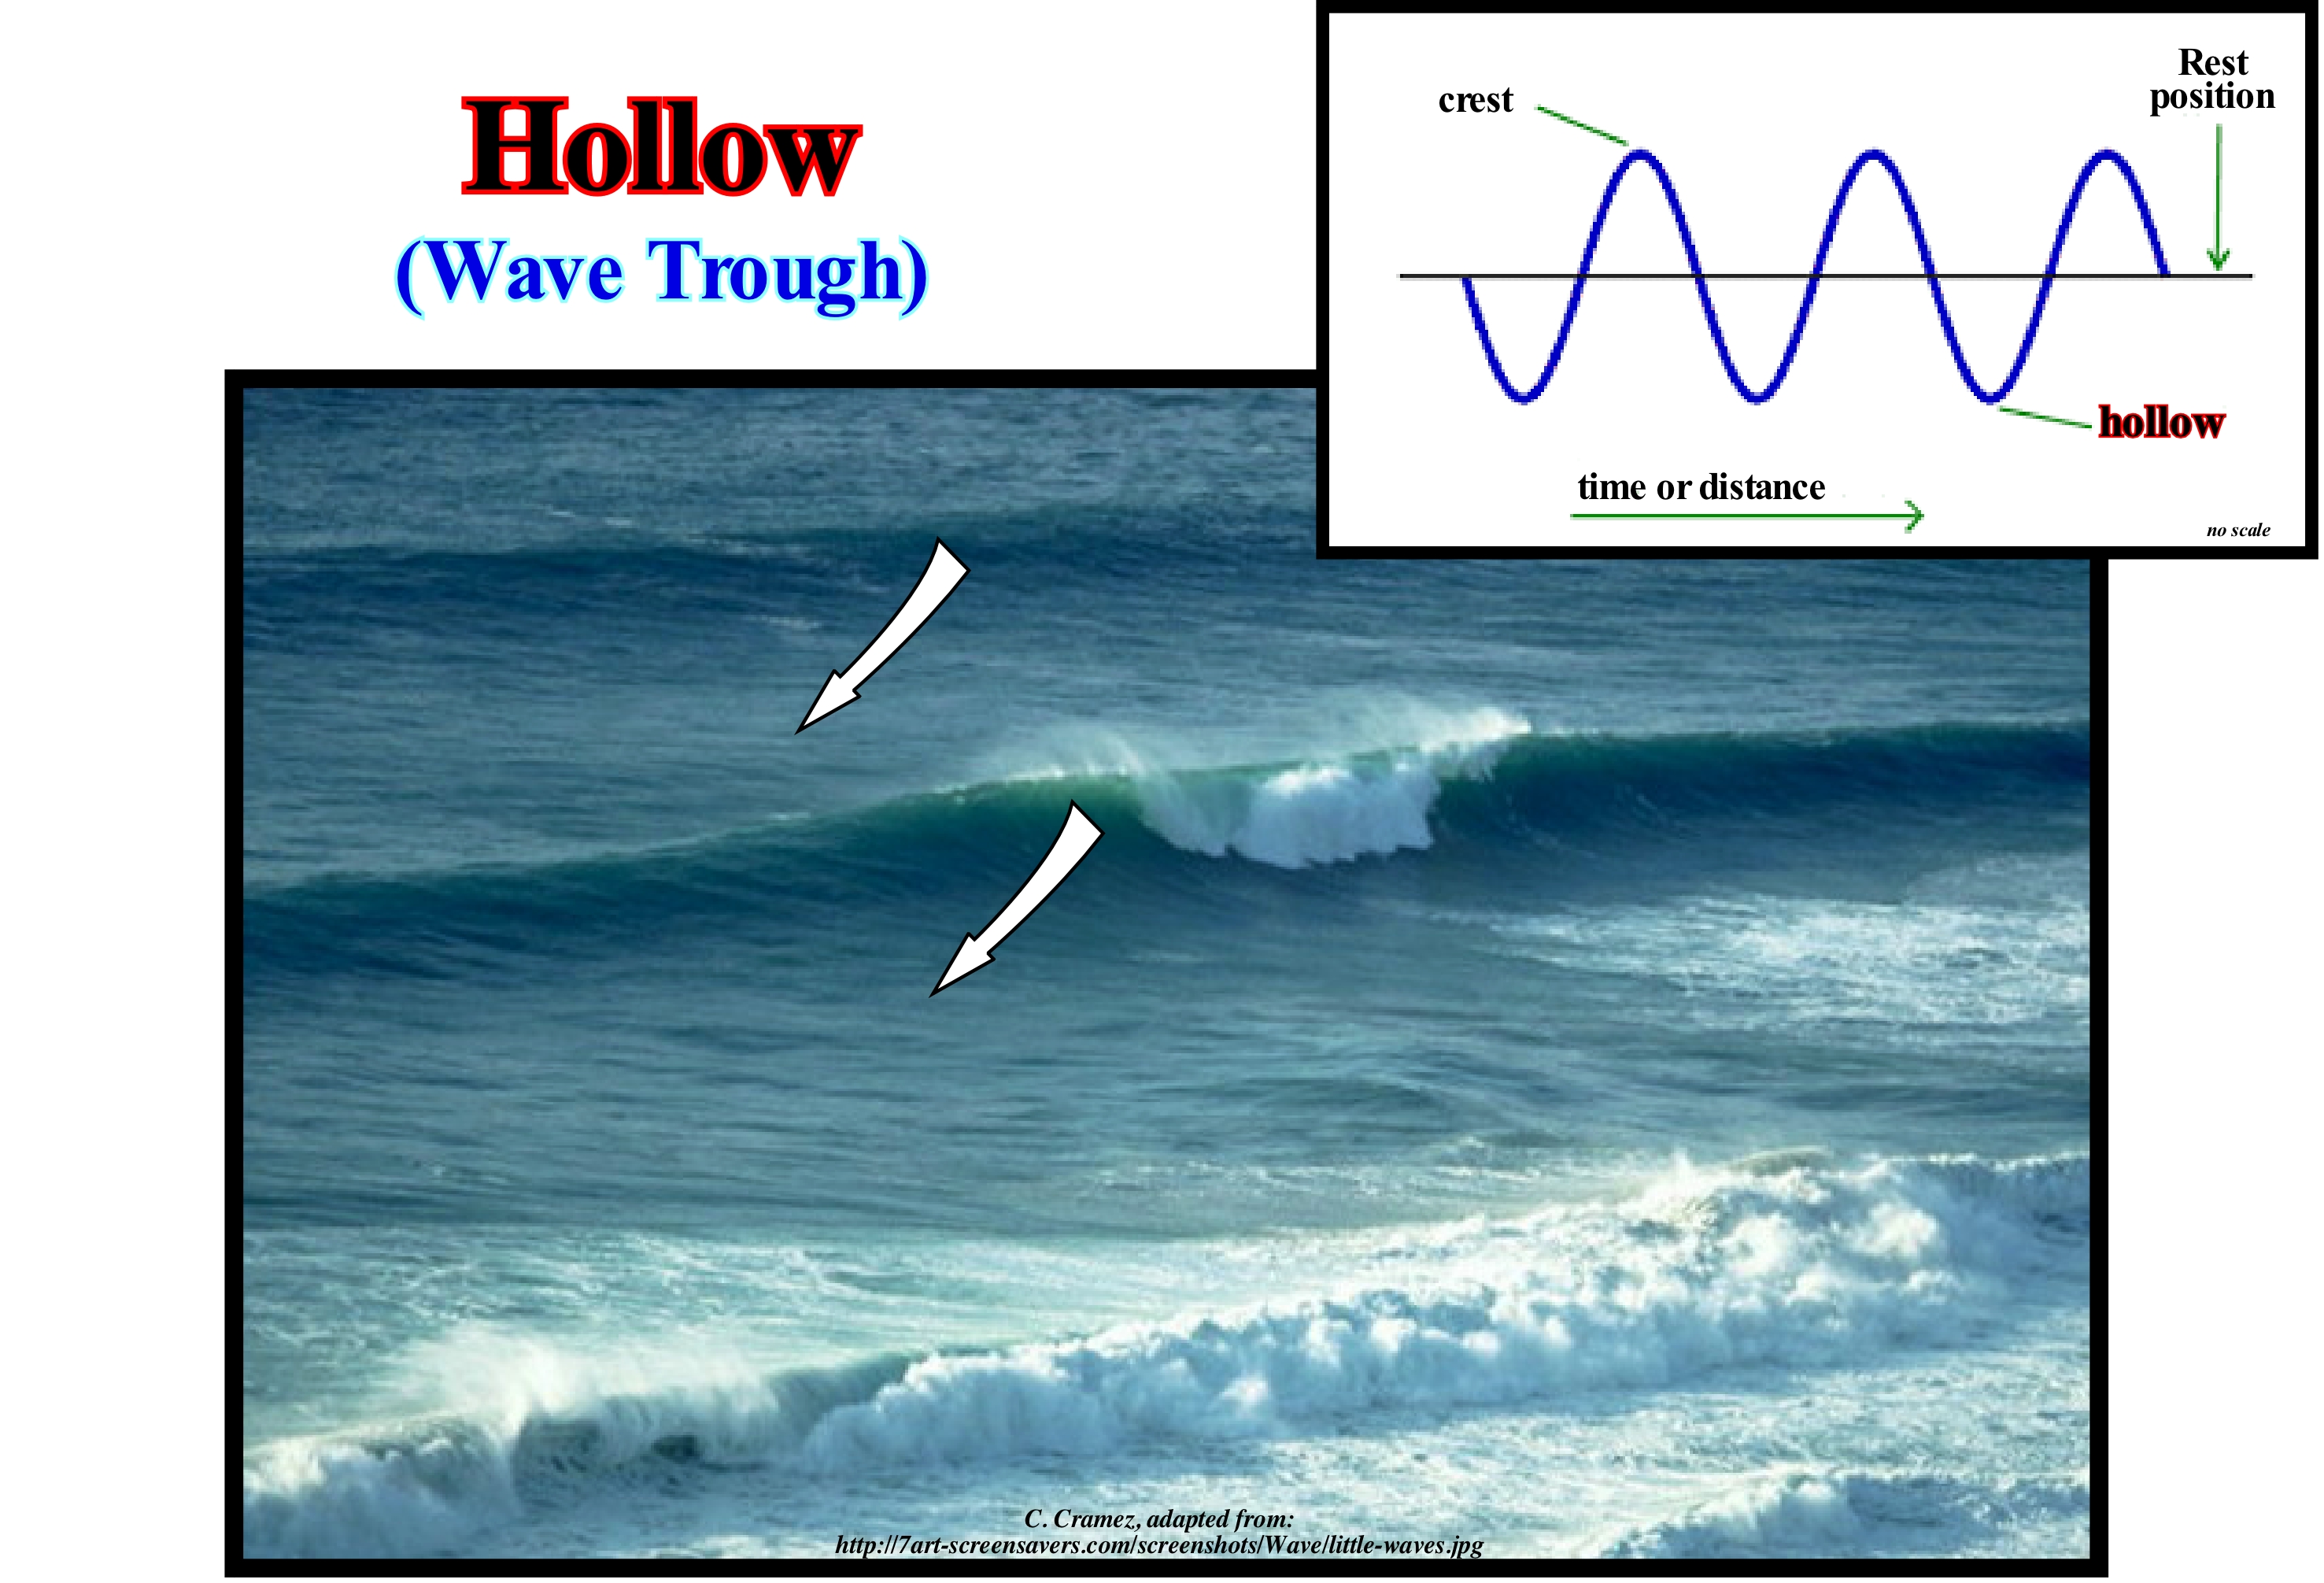
Periodic waves are characterized by crests (high) and hollows (low). They can be classified as longitudinal or transverse. The transverse waves have vibrations perpendicular to the direction of propagation like the waves of a rope and the electromagnetic waves. The longitudinal waves vibrate parallel to the direction of propagation, such as, for example, sound waves. When an object moves up and down on the surface of a lake, it has an orbital trajectory. The waves of a lake are not simple sinusoidal transverse waves. The waves of a lake are a combination of transverse and longitudinal waves, so each point on the surface of the lake follows an orbital path. All waves have a common behaviour under a number of conditions, i.e., all waves can undergo a: (i) Reflection, when the direction of the wave changes as it strikes a reflecting surface ; (ii) Refraction, when the direction of the wave changes when entering a new medium ; (iii) Diffraction, deviation of waves when they encounter an obstacle in their trajectory (the deviation is greater when the wavelength is close to the size of the diffracting object) ; (iv) Interference, when two waves collide ; (v) Dispersion, when a wave where it divides by frequency and (vi) Rectilinear Propagation, when the wave motion is in a straight line. Examples of waves are: (a) Sea waves, which are in fact disturbances that propagate through water ; (b) Radio waves, micro-waves, infrared rays, light (visible), ultraviolet rays, X-rays and gamma rays that form electromagnetic radiation (wave propagation is possible without medium through the vacuum at a speed of about 300,000 km/s) ; (c) Sound waves, which are mechanical waves propagating through gases, liquids and solids; (d) Traffic waves, i.e. the propagation of the different densities of automobiles (these waves can be modelled as kinematic waves) ; (e) Seismic waves (earthquakes), of which there are three types: (i) S (secondary or shear) ; (ii) P (pressure or principal) and (iii) L (Love) waves ; (f) Gravity waves, which correspond to fluctuations in space-time curvature (non-linear waves that have recently be corroborate empirically) ; (g) Inertia waves that occur in rotating liquids and which are restored by the Coriolis effect (reference system in uniform rotation, in which moving bodies, when seen by an observer in the same frame, appear to be subject to a perpendicular force to the direction of your movement).
Hollow Surface......................................................................................................................................................................................................Cariée (Surface)
Cariada (superfície) / Carcomida (superficie), Con caries Superficies) / Zahnfäulig, Zeinaght / 空心面 / Вогнутая поверхность / Cariata (superficie) /
Surface of rock or mineral with small semi-spherical cavities (caries), induced by water corrosion, wind deflation or by granular disaggregation.
See: " Corrosion"
Homeostasis..............................................................................................................................................................................................................Homeostasie
Homeostasia / Homeostasia / Homöostase / 稳态 /Гомеоста́з / Omeostasi /
Property that an organism has to regulate, physiologically, its internal environment in order to guarantee its stability in response to fluctuations of the external environment and climate.
See: « Anaerobic (environment) »
&
« Systems' Theory »
&
« Gaia (hypothesis) »
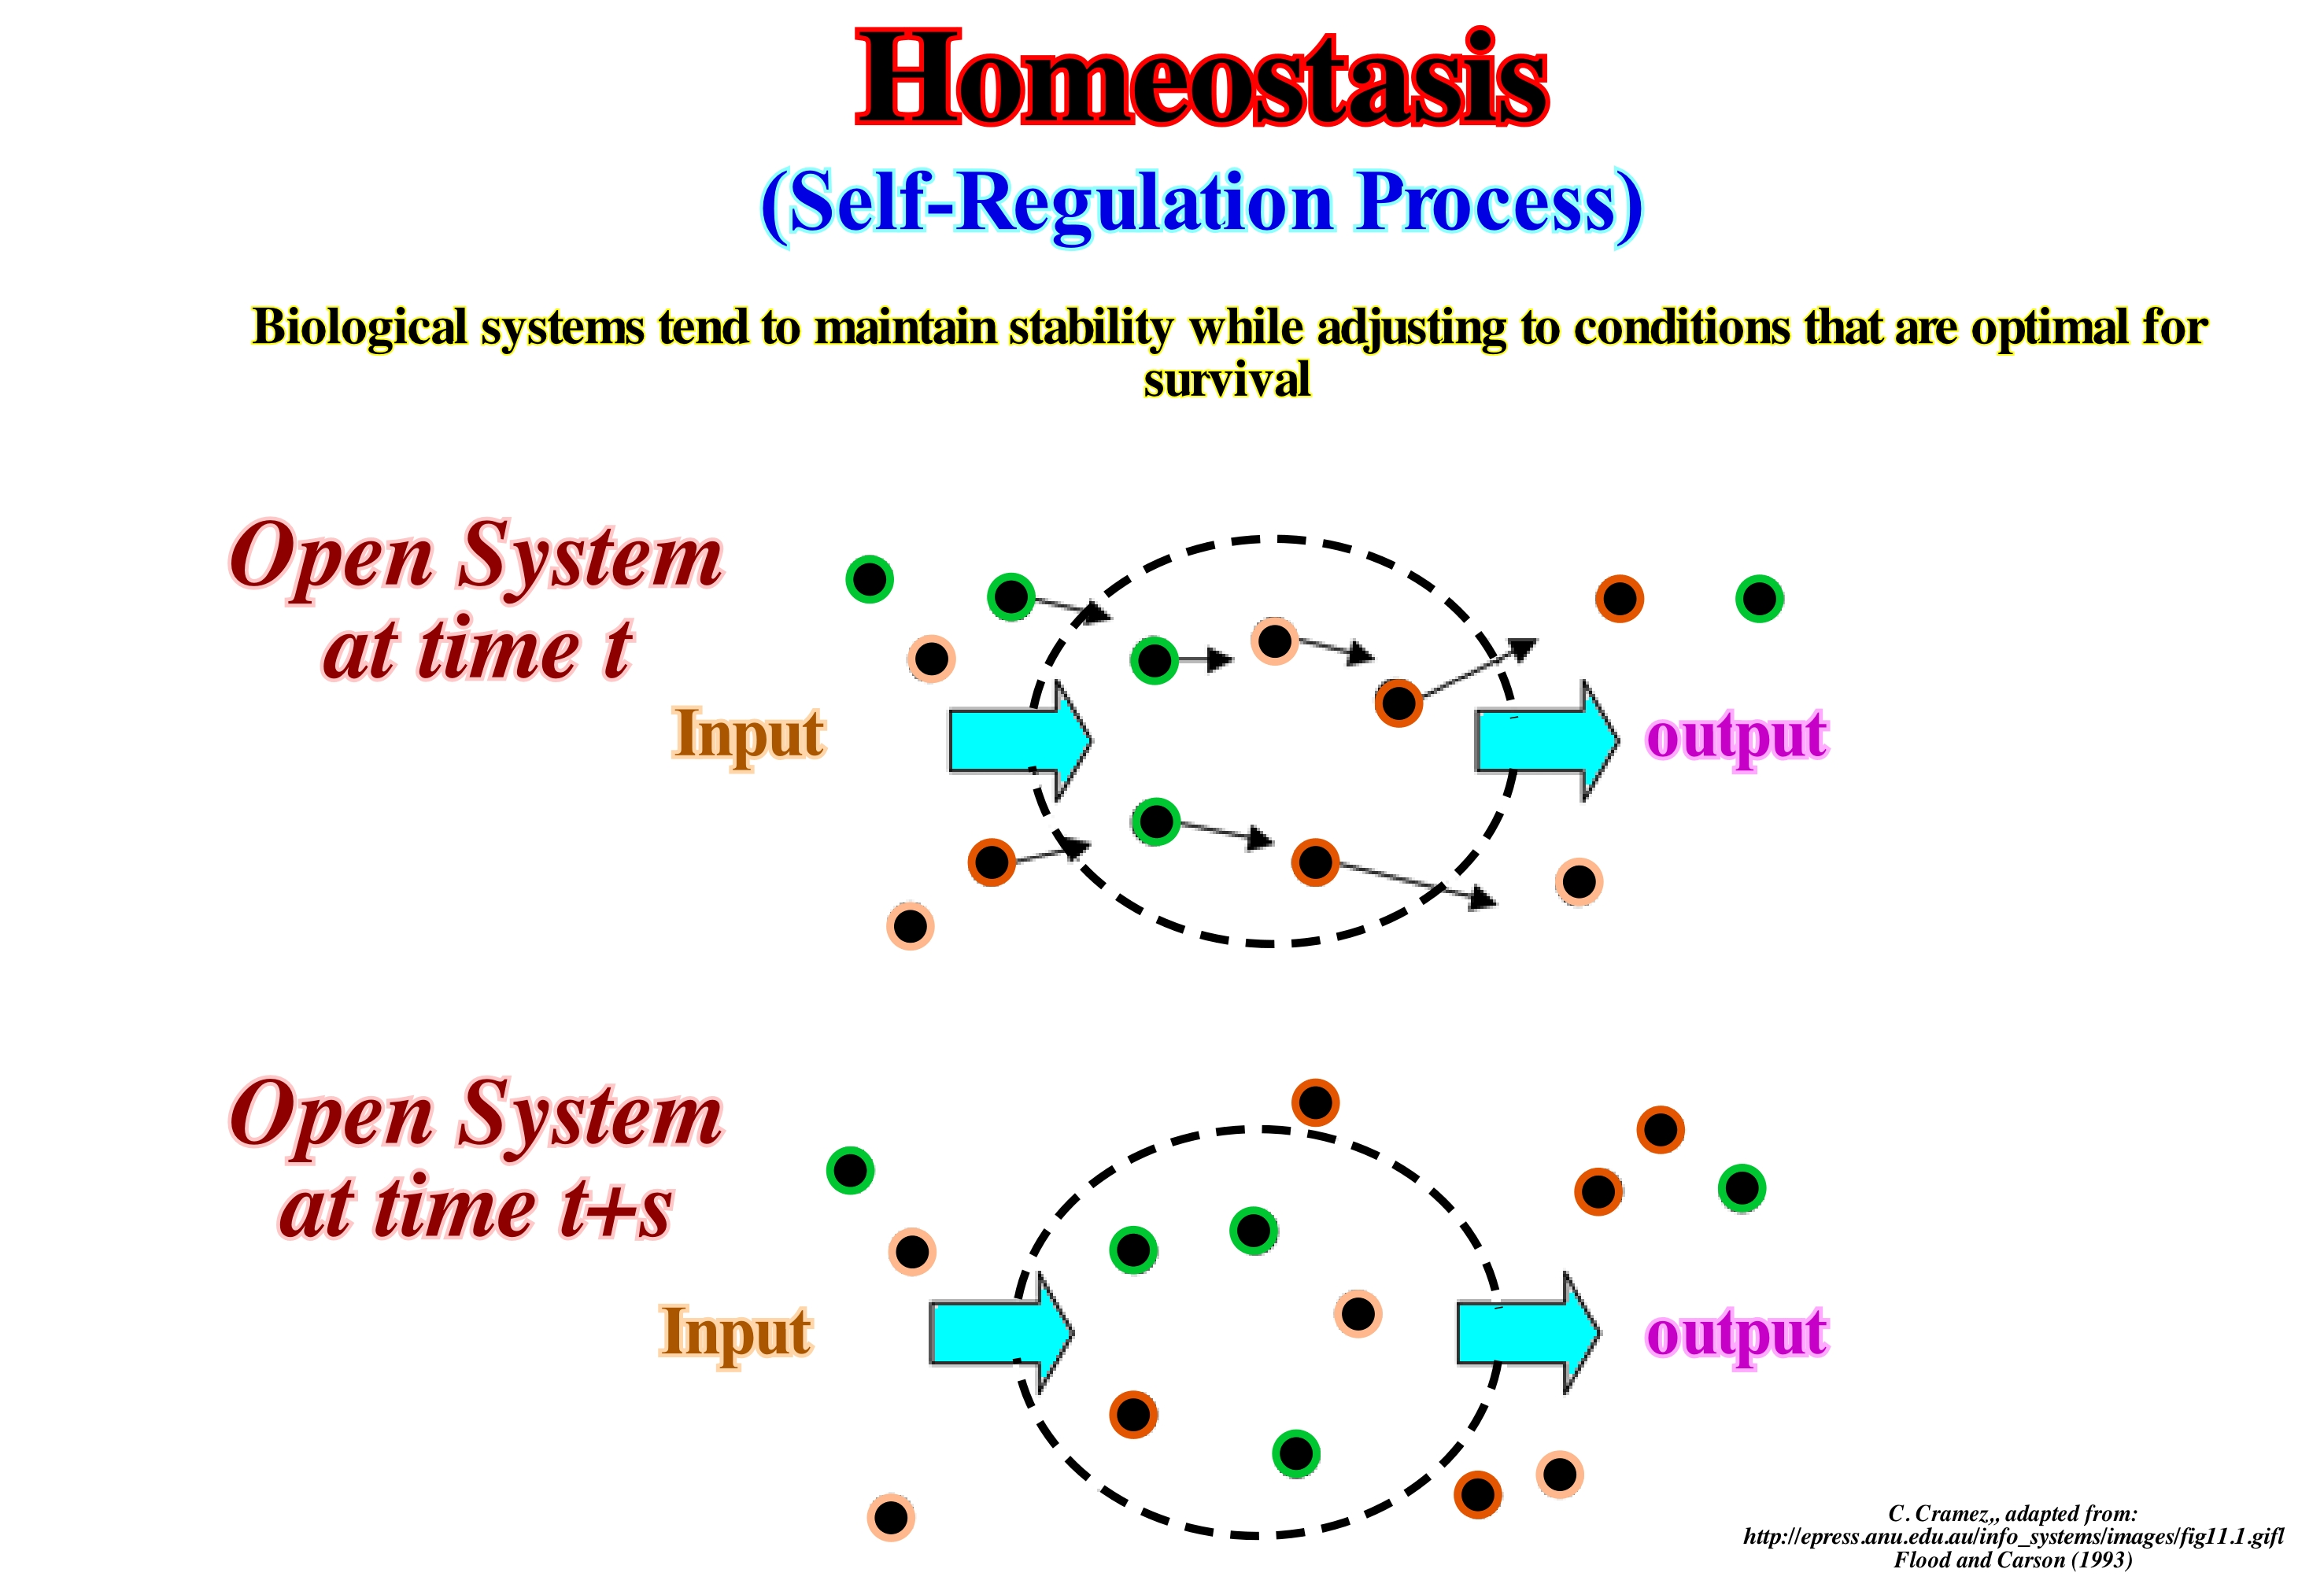
Homeostasis is not just one of the most important properties of any living organism. It is also applicable to human or working organizations treated as open systems. An organization needs to recruit new employees to replace those who retire, but it also needs raw materials, energy and information to use its processes and operations in order to maintain a stable state. An externally static and unchanging organization for external observers is, internally, in a state of dynamic equilibrium flows. Another important aspect of an open system in a dynamic equilibrium state is that it depends on feedback mechanisms to remain in that state. In Boulding's hierarchy, which classifies systems according to their complexity, it is not surprising to discover that properties exhibited by the lower systems of the hierarchy are also found in the higher systems because they are built on the former. A system that is classified as an open system, which has all the qualities that belong to the system at the cybernetic level (self-regulation). The behaviour of open systems is to a large extent determined by the feedback mechanisms present in them. There are two types of feedback that operate on most systems: (i) Negative feedback and (ii) Positive feedback. The first reduces or eliminates the deviation of the system from a given standard. A negative feedback mechanism tends to neutralize the disturbing effect of the environment so that the system can maintain its normal course of operation. On the other hand, it amplifies the positive feedback or accentuates the change, which leads to a continuous divergence from the initial state. Positive feedback contributes to negative feedback in living systems (for instance, organisms and organizations, also, both types of feedback are present during growth, although the result is positive). However, the positive feedback operation alone may, eventually, result in a system of disintegration or collapse. Negative feedback plays a key role in the system's ability to achieve a state of equilibrium or homeostasis.
Homocline Carbonate Platform.............................................Plate-forme carbonatée monoclinale
Plataforma carbonatada monoclinal / Plataforma carbonática monoclinal / Homocline Karbonatplattform / Homocline 单斜碳酸盐台地 / Карбонатная платформа с моноклиналью / Piattaforma carbonatica homoclinal /
A ramp type carbonated platform in which it is difficult to determine the limit between the platform and the continental slope, since the passage of one or the other is gradual and progressive, i.e. without any break in the depositional surface.
See: « Deposition (carbonates) »
&
« Abrupt Carbonate Platform »
&
« Reef »
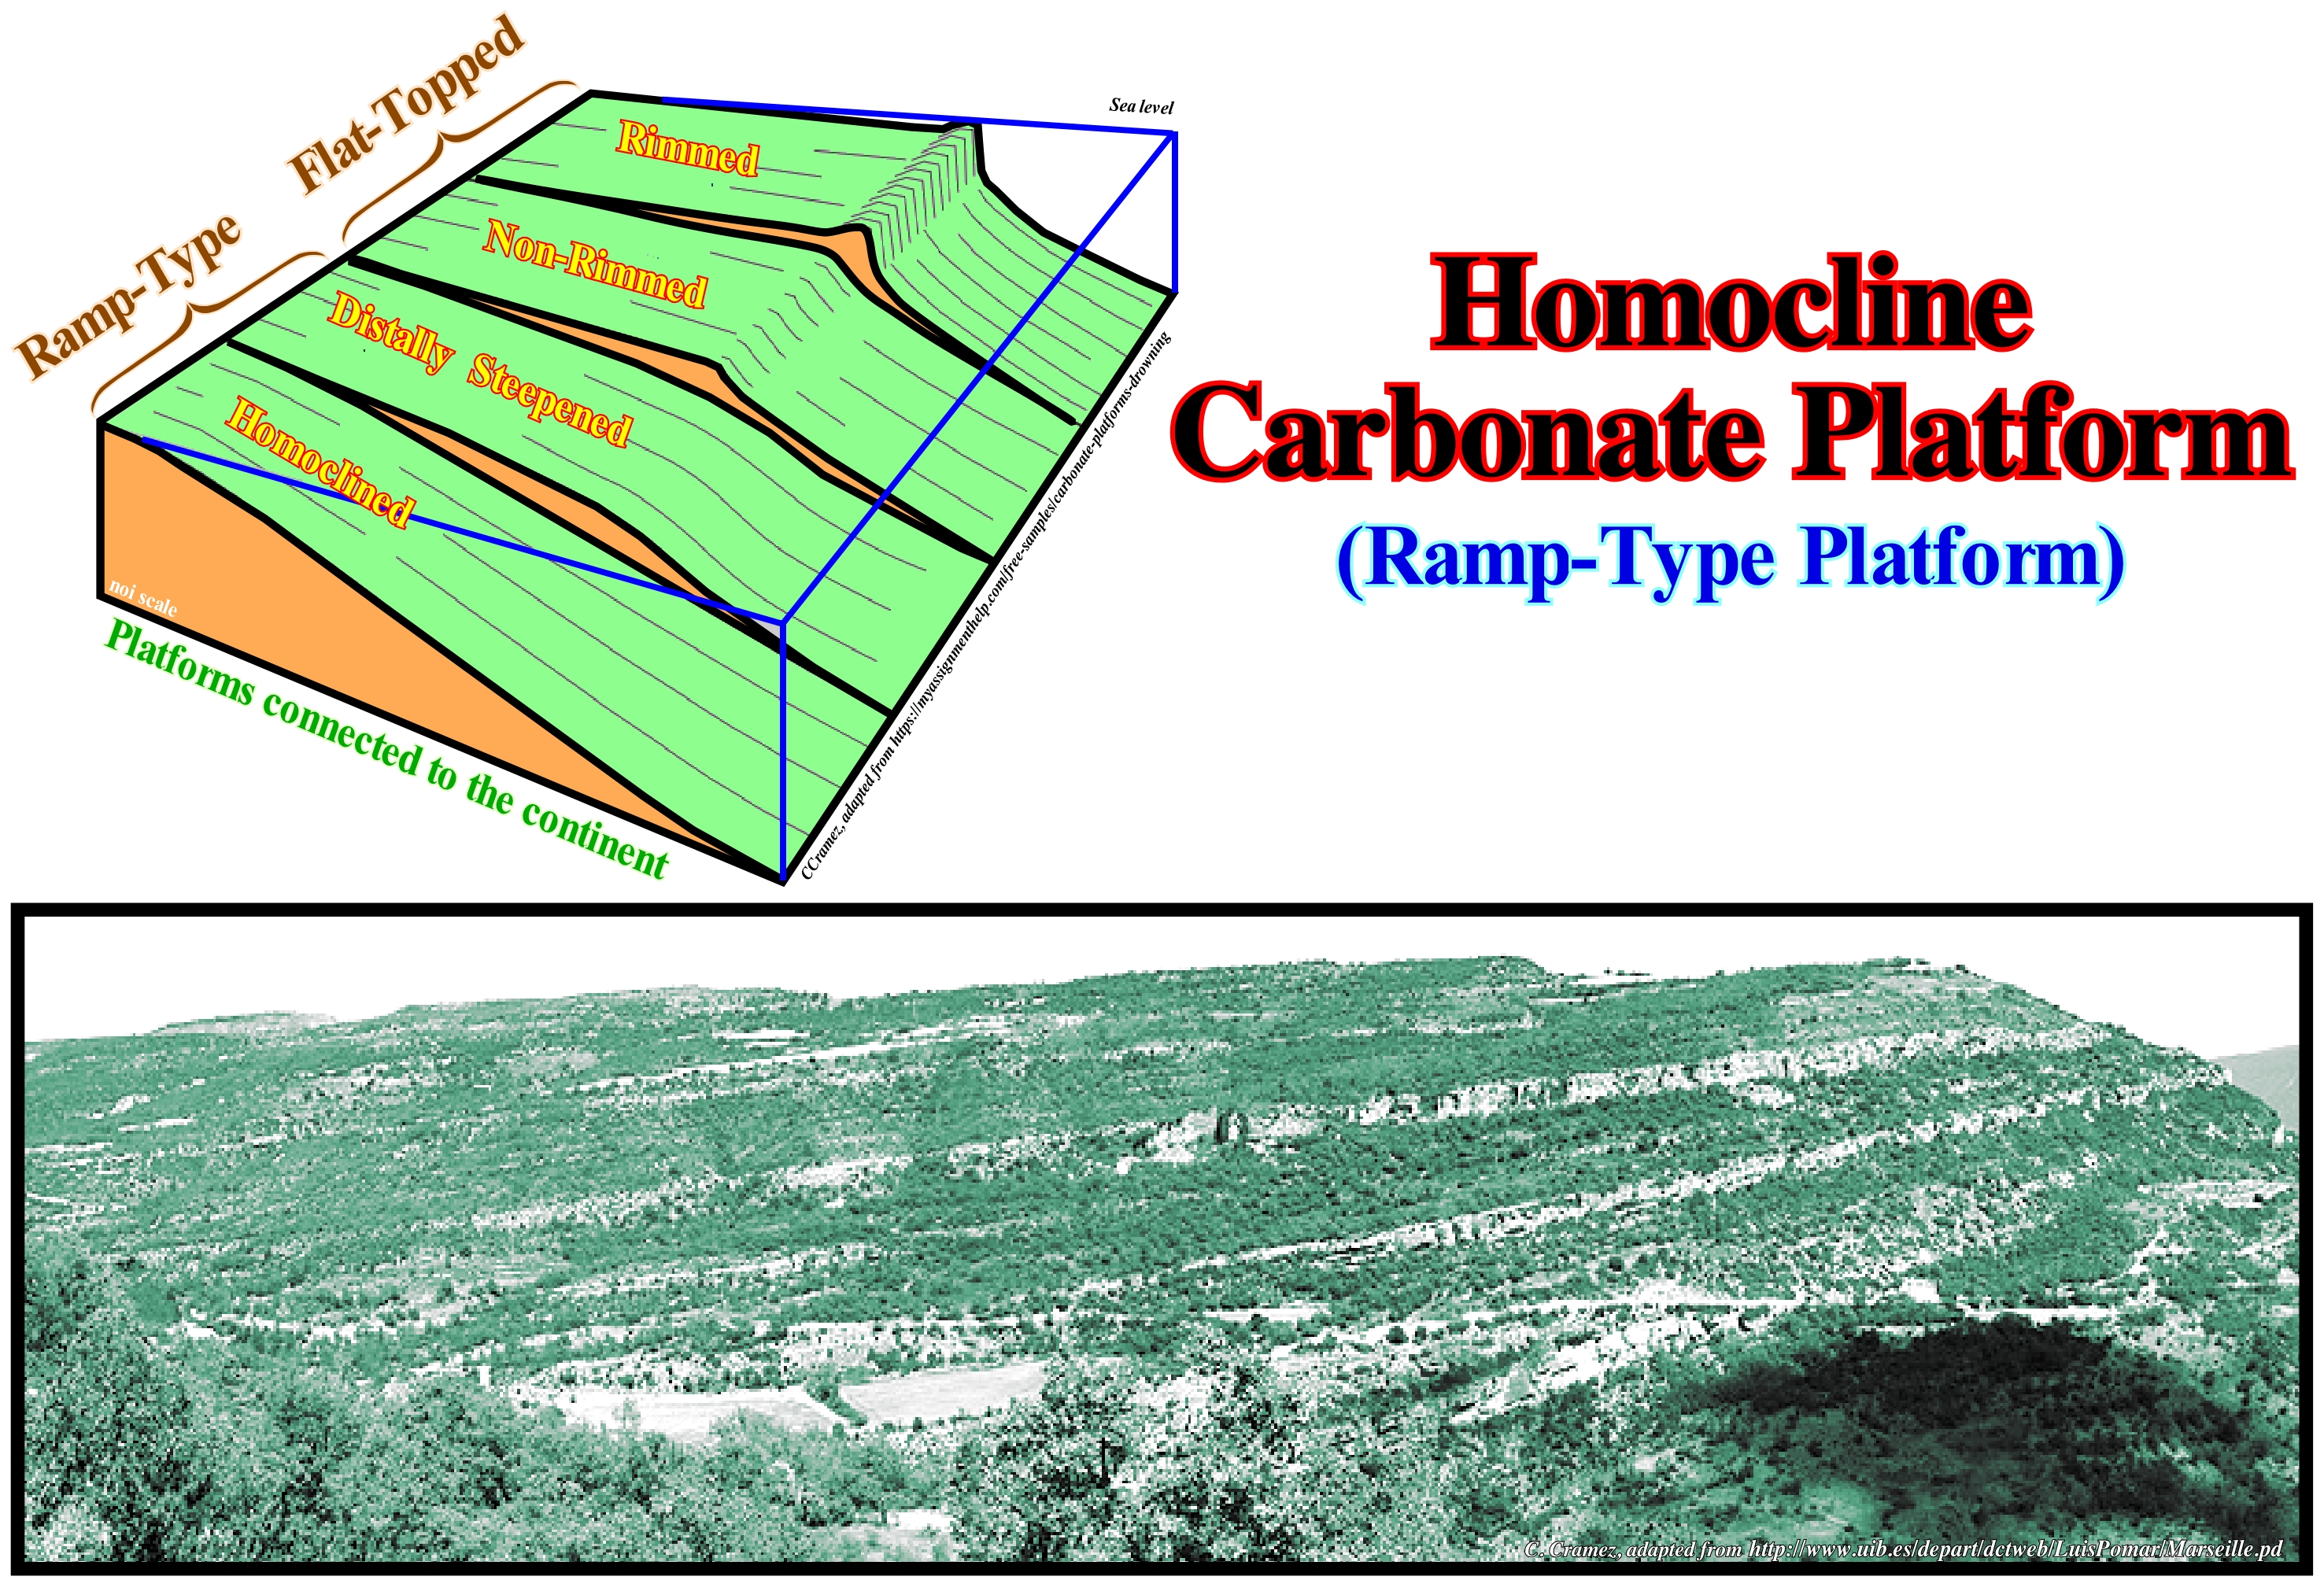
As illustrated in the geological sketch of this figure, the platforms connected to the mainland are, often, sub-divided into two large families: (A) Flat-Topped Platform and (B) Ramp-Type Platforms. On flat-topped platforms (A), there are o two subtypes: (A.1) Rimmed and (A.2) Nonrimmed. In ramp-type platforms (B), two sub-types can be considered: (B.1) Distally Steepened and (B.2) Homoclinal. The carbonated platform illustrated in the photograph of this figure is, probably, a ramp-type platform of the monoclinal subtype. According to some geoscientists, this type of platform seems to be more frequent when the processes of carbonate manufacture are in cold water. When carbonate manufacturing processes are associated with tropical climates, carbonate platforms are, usually, flat-topped or they correspond to mounds of mud with no marked zones. Most of the geoscientists consider five main types of carbonated platforms: A) Rimmed Platforms ; B) Ramp Carbonated-Type Platforms ; C) Epeirial (or epiric) Platforms ; E) Drowned (or dead) Platforms. Rimmed platforms are characterized by the presence of reefs or calcareous sand shoals (carbonated sandbank covered by shallow sea water) in the platform edge and clay sands in the lagoon or open platform. This type of platform forms in calm waters and its extension varies between 10 and 100 km. In ramp carbonated-type platforms, the carbonated sands of the shoreline pass, at the base of the ramp, to clay sands and deep water mud. In this type of platform the reefs are rare and the width of the ramp can reach 100 km. Epeirial (or epiric) platforms are characterized by the presence of tidal surfaces and protected lagoons. The width of an epeiric platform can reach 10,000 km. In isolated Platforms, the facies (lithologies) are, mainly, controlled by the orientation of the dominant winds. These platforms have reefs and sandy bodies, such as the rimmed platform, in the windward margin (facing the side where the wind blows), but in the leeward margin (in the direction where the wind blows), the sediments are more muddy. An isolated platform can reach 100 km wide. Drowned (or dead) platforms, that are under the photic zone (where there is not enough light for photosynthesis, i.e., use of carbon dioxide, CO2, and water to obtain glucose through the energy of sunlight). Do not forget that a continental shelf or, simply, shelf, whose depth varies between 0 and 200 meters, is a physiographic province. It is part of the continental margin morphological structure (submarine extension of the continental block) and that a carbonate platform is a sedimentary body, with a topographic relief, composed of calcareous deposits that have been formed "in situ", i.e., autochthonous calcareous deposits. Under normal conditions, the water-depth of a limestone platform can not exceed the depth of the photic zone, i.e., a carbonated platform may coincide with a shelf, but, generally, this does not appear to be the case. The most well-known carbonate platform geometry is associated with tropical manufacturing processes, where carbonate platforms can be subdivided into three main sedimentary environments: 1) Reef, which is the part of the carbonate platform created in situ by sessile organisms ; 2) Internal lagoon (part of the platform behind the reef, which is characterized by shallow and calm waters with sediments composed of fragments of reefs and hard parts of organisms or sediments terrigeneous when the reef is epicontinental) and 3) Slope or reef slope, which connects the reef to the basin and acts as a sink for the excess carbonate sediment, although most of the sediment produced in the lagoon and the reef is transported by various processes and accumulated on the slope.
Homotaxy.................................................................................................................................................................................................................................Homotaxie
Homotaxia / Homotaxia / Homotaxy (Ähnlichkeit der Anordnung) / Homotaxy (相似的安排) / Гомотаксис / Homotaxy (somiglianza di sistemazione) /
Similarity of an arrangement of the parts of a whole. Analogy between stratigraphic intervals or fossil successions in different regions. Analogy of the arrangement of the strata characterized by similar fossils that occupy different positions and without connotation of ages. Analogy of arrangement of fossils with the same relative position, but which are not necessarily contemporaneous. Term introduced to avoid confusion between a taxonomic analogy and synchronism.
See: « Facies »
&
« Index Fossil »
&
« Relative Age »
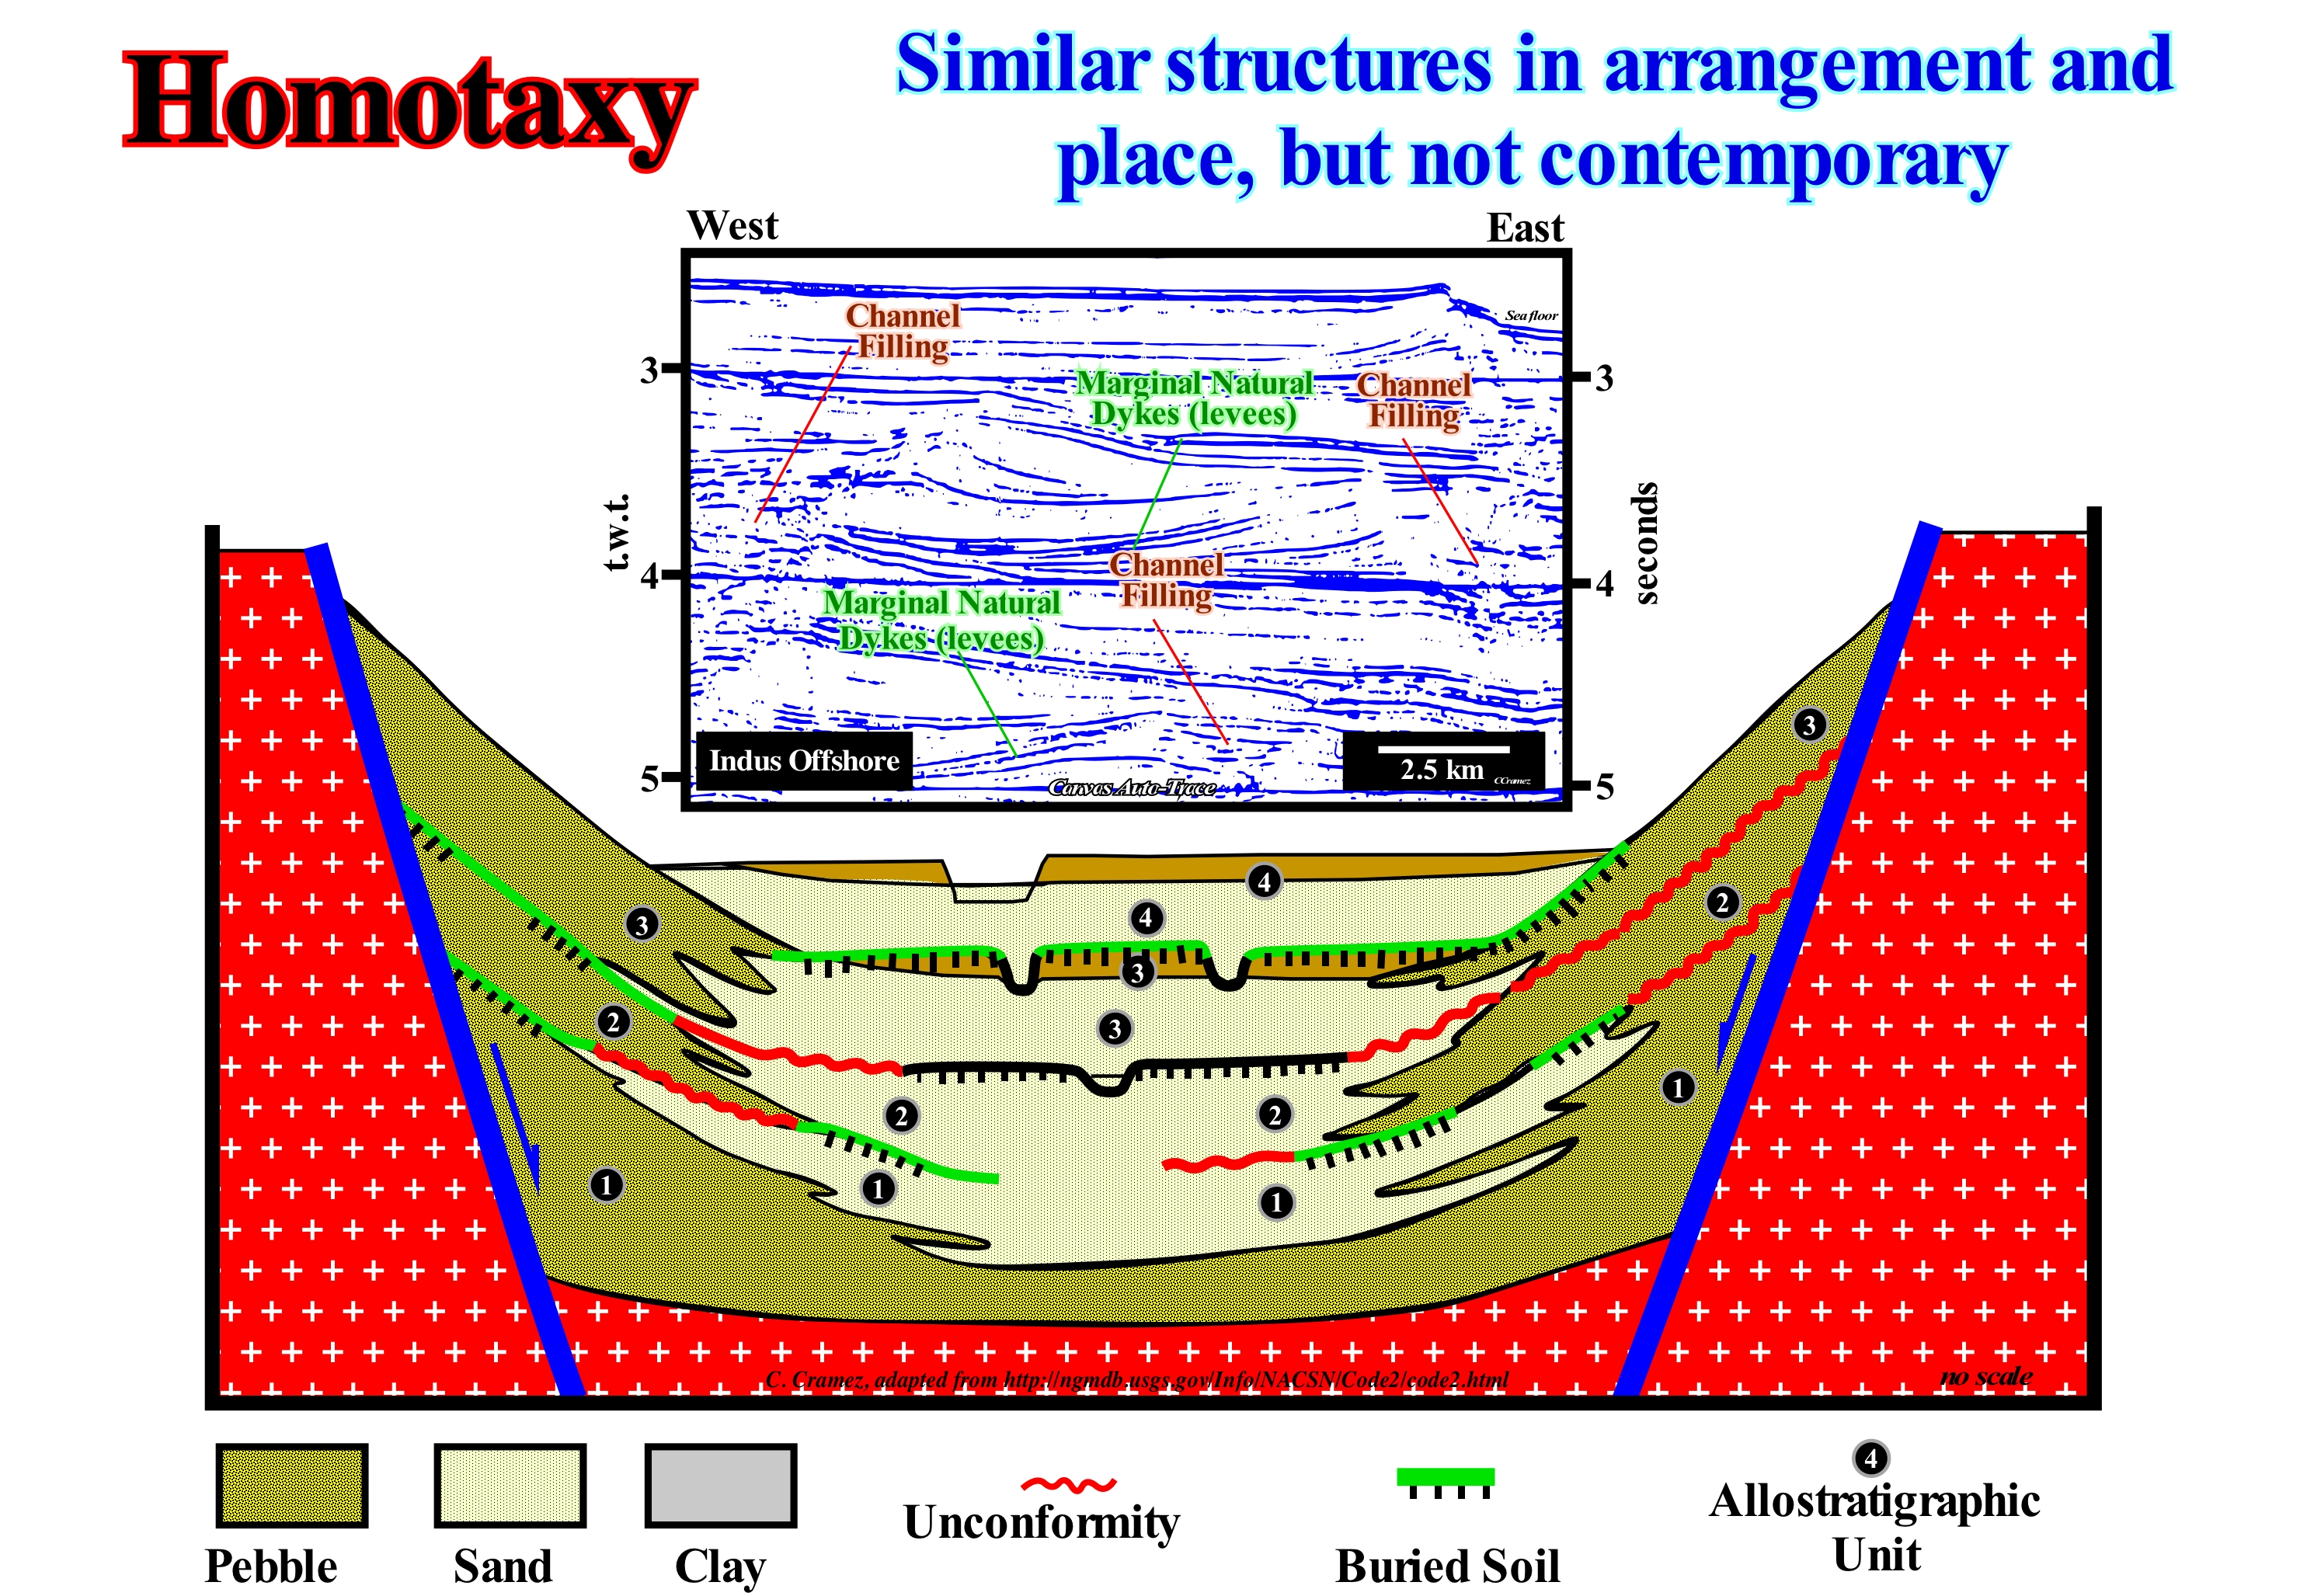
Homotaxy was, initially, proposed by Huxley (1982) to avoid the fallacy of confusing a taxonomic similarity* with synchronism. Today, homotaxy is often defined as the taxonomic similarity between stratigraphic or fossil sequences in separate regions (Bates & Jackson, 1987), or the fact that of strata characterized by fossils occupy similar positions in different vertical sequences without, however, necessarily the same age. The term homotaxy may also be used to express the fact that non-contemporary strata or layers (often too far apart from each other) may contain the same fossils. To demonstrate that a succession of fauna, flora or taxa (plural of taxon) can be confirmed from one geological section to another, from one sedimentary basin to another or from one continent to another, is not easy but is what many geoscientists call homotaxy. Observing the same fossils in two outcrops of different sedimentary basins does not in any way show that these outcrops are synchronous. In reality, that is, the great problem of index fossils (with a large spatial distribution and occurring for a short time), and the main question is how to proceed from ordered geological events to dated geological events. This problem constitutes the great impasse of biostratigraphy. The paleobiological and stratigraphic data characteristic of a given geological event do not allow to establish its synchronism. On this subject one can not forget that: (i) Fossils signify a succession of irreversible events and (ii) Biostratigraphic correlations depend on the evolutionary emergence of a species, from its ancestor, on its survival and geographic expansion. The principle of correlations assumes that biological communities, in different places, are synchronized or that biological signals are transmitted, instantaneously, or both, which is not necessarily true. Scott, GH (1985) considered the main problem in biostratigraphy is the justification of the use of fossils to identify isochron horizons and proposed a first solution. Geoscientists establish sequences of fossil events, but there is no theoretical justification to consider that the same stratigraphic position (homotaxy) corresponds to the same deposition time. Scott proposed a first solution using homotaxy as a test of diachronism, i.e., events that do not maintain an invariant stratigraphic order are considered to be diachronic. Events that resist this test are not considered isochronous, but the potential diachronism of their individual distributions is, inversely, related to their stratigraphic spacing. The closer the homotaxial events in the stratigraphic space, the less they are separated in time. Thus, one of the main objectives of biostratigraphic research should be to make more stringent homotaxy tests by increasing the density of events. The scheme illustrated in this figure, which is a good example of an allostratigraphic interpretation** of the alluvial and lacustrine deposits of a rift-type basin, whether the basin is Cretaceous or Neogene, shows that the concept of homotaxy can also be applied to lithological correlations, to designate the fact that strata characterized by geometric relationships and similar positions in different vertical sequences regardless of their age. In fact, in this geological section, the alluvial and lacustrine deposits can be included in a single geological formation or they can be separated, laterally, into distinct geological formations on the basis of the contrasts of lithology (pebble, clay). The lithology changes are abrupt and accentuated, both vertically and laterally. Homotaxy does not imply, necessarily, a timing of deposits. Alluvial and lacustrine deposits, for example, may be included in a single geological formation or be, laterally, separated into distinct formations on the basis of the geometric relationships or the basis of their fossils. However, four allostratigraphic units, each including two or three facies, can be defined on the basis of laterally mapped discontinuities. As can be seen in the Canvas auto-trace of a detail of an Indus regional seismic line, it is evident that the similarity and diachronism of the submarine slope fans (gull-wing structures of P. Vail) are, overall, a good example of homotaxy.
(*) Same groups of biological organisms.
(**) Mapped stratigraphic units defined and identified on the basis of the discontinuities that limit them.
Horizon (Geological, seismic)..........................................................................................................................................Horizon (Géologique, Sismique)
Horizonte / Horizonte (geológico, sísmico) / Horizont (geologischen, seismischen) / 地平线(地质,地震) / Горизонт (геологический, сейсмический) / Orizzonte (geologico, sismico) /
Bed or a set of beds with a particular composition and characteristic fossils, which allow to give it a relative age. On the seismic lines, a horizon is a, more or less, continuous reflector that underlines an interface between two stratigraphic intervals with different acoustic impedances (product of seismic wave velocity through a range of its density).
See: « Seismic Reflection »
&
« Geological Section »
&
« Marker Bed »
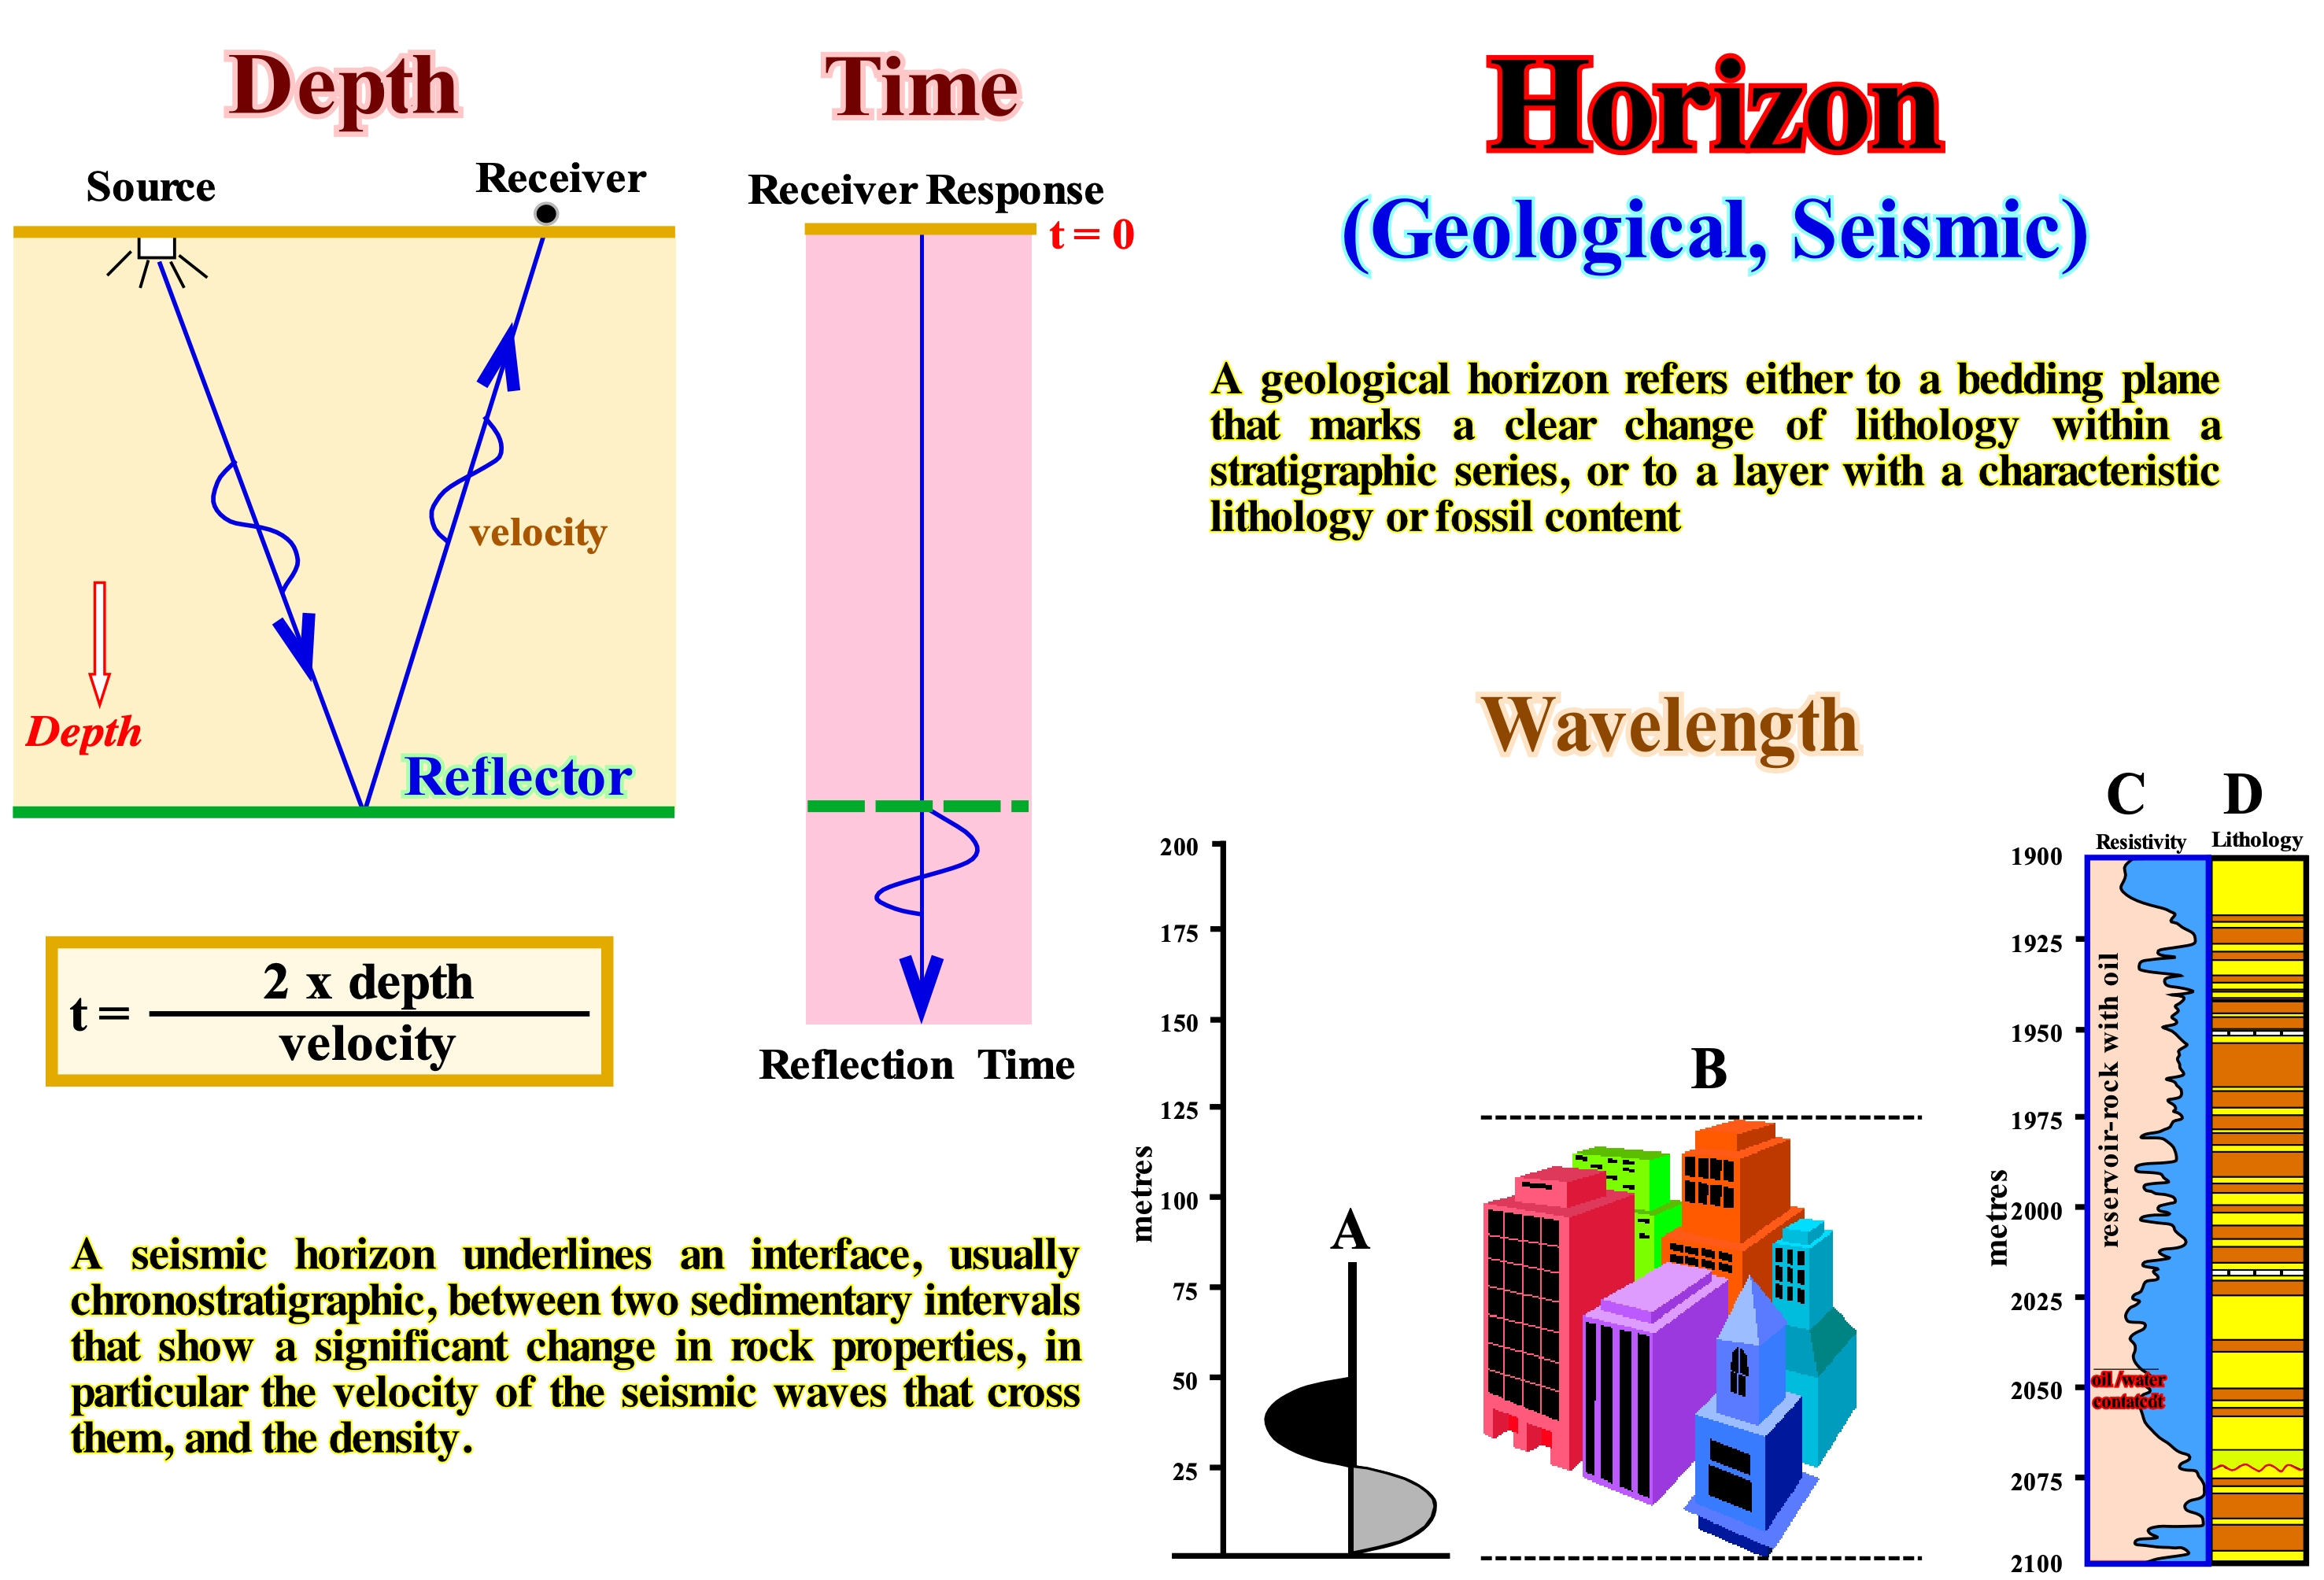
These sketches illustrate, in depth and time, one of the basic mechanisms of reflection seismics, which should never be forgotten when geoscientists interpret seismic lines in geological terms. On the left, in the "Depth" sketch one can see the energy source, the depth of a reflector (interface between two sedimentary intervals), the receiver (geophone) and the seismic wave path, materialized by the radius path, while in the "Time" sketch there is an answer in time. The time spent by a wave is equal to twice the depth of the reflector, i.e., round trip (path = source/ reflector and back = reflector/geophone) to be divided by the speed of the waves in the considered medium. The depth response is given by the depth of the reflector in time multiplied by the velocity of the seismic waves within the sedimentary interval overlying the reflector. A comparison of (A) a cycle of a 30 Hz* seismic wave, in a velocity medium 1,832 m/s (60 Hz with 3,500 m/s), (B ) height of the buildings of a city and (C) the stratigraphic column crossed by a research well in an area where an economic accumulation of hydrocarbons was found, i.e., an oil field. A cycle of a normal seismic wave is almost always inferior to a building of 50 m of height. When a geoscientist proposes, in a tentative of geological interpretation of a seismic line, geological bodies of small size such as the incised valley filling, a point bar, etc., it is imperative that they take into account the scales and the resolution of the seismic lines. The vertical seismic resolution that corresponds to the minimum vertical distance between two interfaces, necessary for a simple reflection to be observed, is, rarely, less than 50 m. It is mainly controlled by the wavelength of the seismic signal. As the thickness of a given interval approaches a quarter of wave-length, constructive interference produces an amplitude accumulation known as the tuning effect, whose thickness is, generally, considered as the limit of resolution or separability as said by certain geoscientists. Since the wave-length is equal to the velocity divided by the frequency, a quarter of wavelength represents about 7 m for shallow intervals with a velocity of plus or minus 1,828 m/s for a wavelet* of 60 Hz or of about 76 meters for deep intervals with a velocity of 4,500 m/s and a 15 Hz reverberation. The resolution decreases with depth because the velocity increases and frequency decreases. The lateral seismic resolution is determined by the radius of the Fresnel zone which depends on the wave-length (acoustic pulse) and the depth of the reflector. In fact, the seismic waves that give rise to a reflection event are reflected from a fairly large, approximately, circular area of the reflecting interface known as the first Fresnel zone. Reflections from this zone come to a geophone to interfere constructively. The radius of this zone is, often, taken as the horizontal resolution for unmigrated seismic data. For a radius of 60 Hz to 1,706 metres/second, this radius would be about 152 meters at a depth of 1,524 meters. The size of the Fresnel zone, too, increases, rapidly, in depth. As the migration collapses Fresnel zone, this resolution measure is not appropriate for the migrated seismic data that are, currently, the most used for attempts at geological interpretation of seismic lines. In principle, after the migration, the horizontal resolution is reduced to plot the spacing. However, noise (migration spotting of certain geoscientists) often becomes a factor that can, significantly, reduce resolution. Other factors may contribute to limit lateral resolution, such as the uncertainty of the velocity of interval, the mathematical completeness of the migration algorithm and spatial sampling (interval between geophones).
(*) A frequency-derived unit of the international system (SI), which is equivalent to one event per second (s-1 or 1/s) and is connected to velocity (v) and wavelength (λ) by the relation: f = v / λ.
(**) A wavelet is a function capable of decomposing and describing or representing another function, originally described in time, so that this other function can be analyzed in different frequency and time scales.
Hotspot.......................................................................................................................................................................................................................................Point chaud
Ponto quente / Punto caliente / Hotspot / 热点 / Опасная точка (центр волнений) / Punto caldo /
Term used to express the volcanic columns that rise from the mantle to the lithosphere.
See: « Asthenosphere »
&
« Lithosphere »
&
« Sea Floor Spreading »
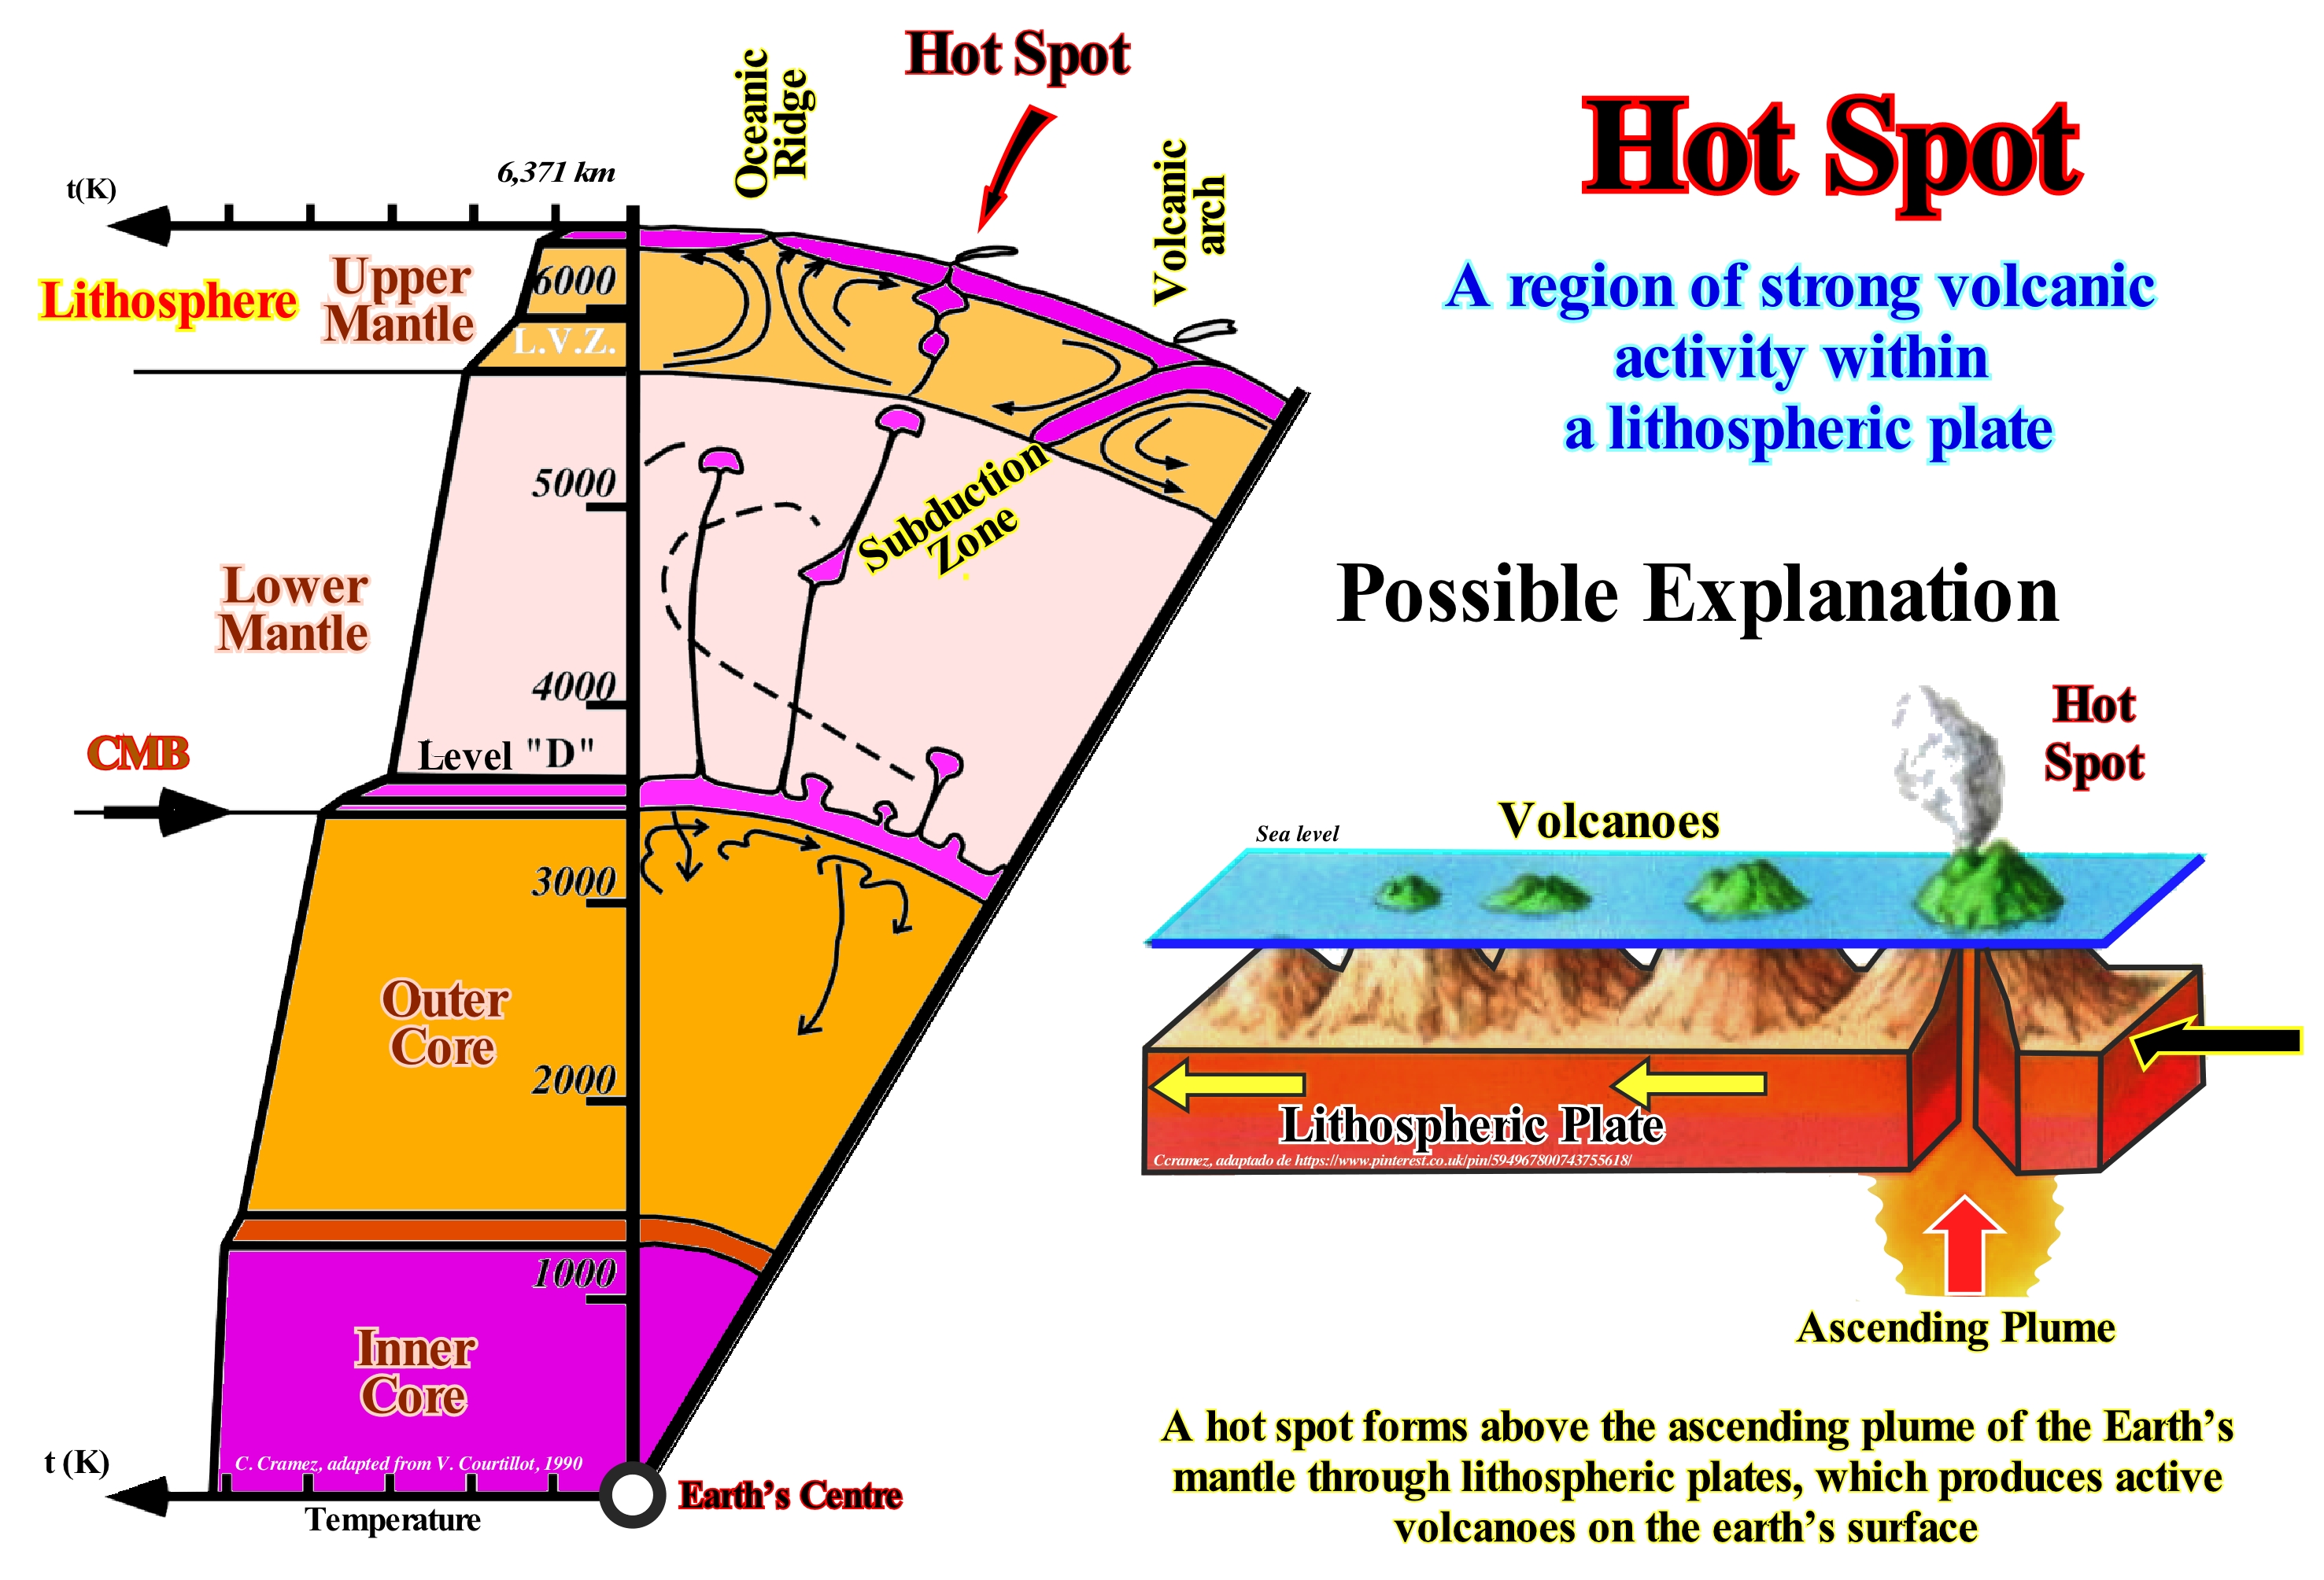
From the point of view of petrography, the internal structure of the Earth can be divided into three concentric envelopes: (i) Continental Crust composed mainly by granite and metamorphic rocks, which are, generally, covered by sedimentary rocks ; (ii) Mantle that is composed, mainly, of anhydrous peridotites and eclogites and (iii) Core, that is, mainly, composed by iron and nickel and that can be sub-divided into a solid outer core and liquid inner core (not crossed by the S waves). The crust thickness varies between 30 and 70 km. The average density of the upper continental crust is 2.5-2.7 g/cm3. The lower continental crust, which is, mainly, composed of gabbros, has an average density of 2.8 g/cm3. The oceanic crust is, mainly, composed of basaltic rocks and gabbros, which are almost always covered by pelagic and hemipelagic sediments. The average density of the oceanic crust is about 2.9 g/cm3 and its thickness varies between 4 and 10 km. The average density of the mantle is 3.3-3.4 g/cm3. The boundary between the crust and the earth's mantle is underscored by Mohorovičić's discontinuity, whose depth varies between 4 and 70 km. The lower mantle boundary is more or less located at 680 km (with a ± 20 km error) and appears to correspond to a phase change. The lower mantle has the same chemical composition as the upper mantle, but is, probably, in a different phase. At the top, the average density of the mantle is about 3.3 g / cm3 and about 5.6 g/cm3 at the deepest part, that is, at 2,900 km depth. The core is composed mainly of iron and nickel. As shown in this diagram, hot spots allow the transfer of material between the lower mantle and the lithosphere. The vast majority of the geoscientists think that hot spots are induced by, relatively, narrow convection currents called plumes that start from the boundary between the core and the Earth's mantle, although others think the main cause is the convection currents of the mantle higher. Recently, certain geoscientists have advanced the hypothesis that at least some of the 40-50 hot spots recorded to date may be induced by the impact of large meteorite. A hot spot may form a, more or less, continuous series of volcanoes on a lithospheric plate that moves over it.
Hubbert's Curve..........................................................................................................................................................................Courbe de Hubbert
Curva de Hubbert / Curva de Hubbert / Hubbert-Kurve / 哈伯特的曲线 / Кривая Хабберта / Curva di Hubbert /
Derivative curve of a logistic function. It looks, but is different, from a probability density curve of a normal distribution (bell-shaped, symmetric). The Hubbert curve is used to model the rate of oil production. According to this model, the rate of oil production is determined by the rate of new discoveries, i.e., that a peak in the production rate curve is followed by a gradual decline in oil production.
See: « Eustatic Sea Level Curve »
&
« Geological Time »
&
« Seismostratigraphy »
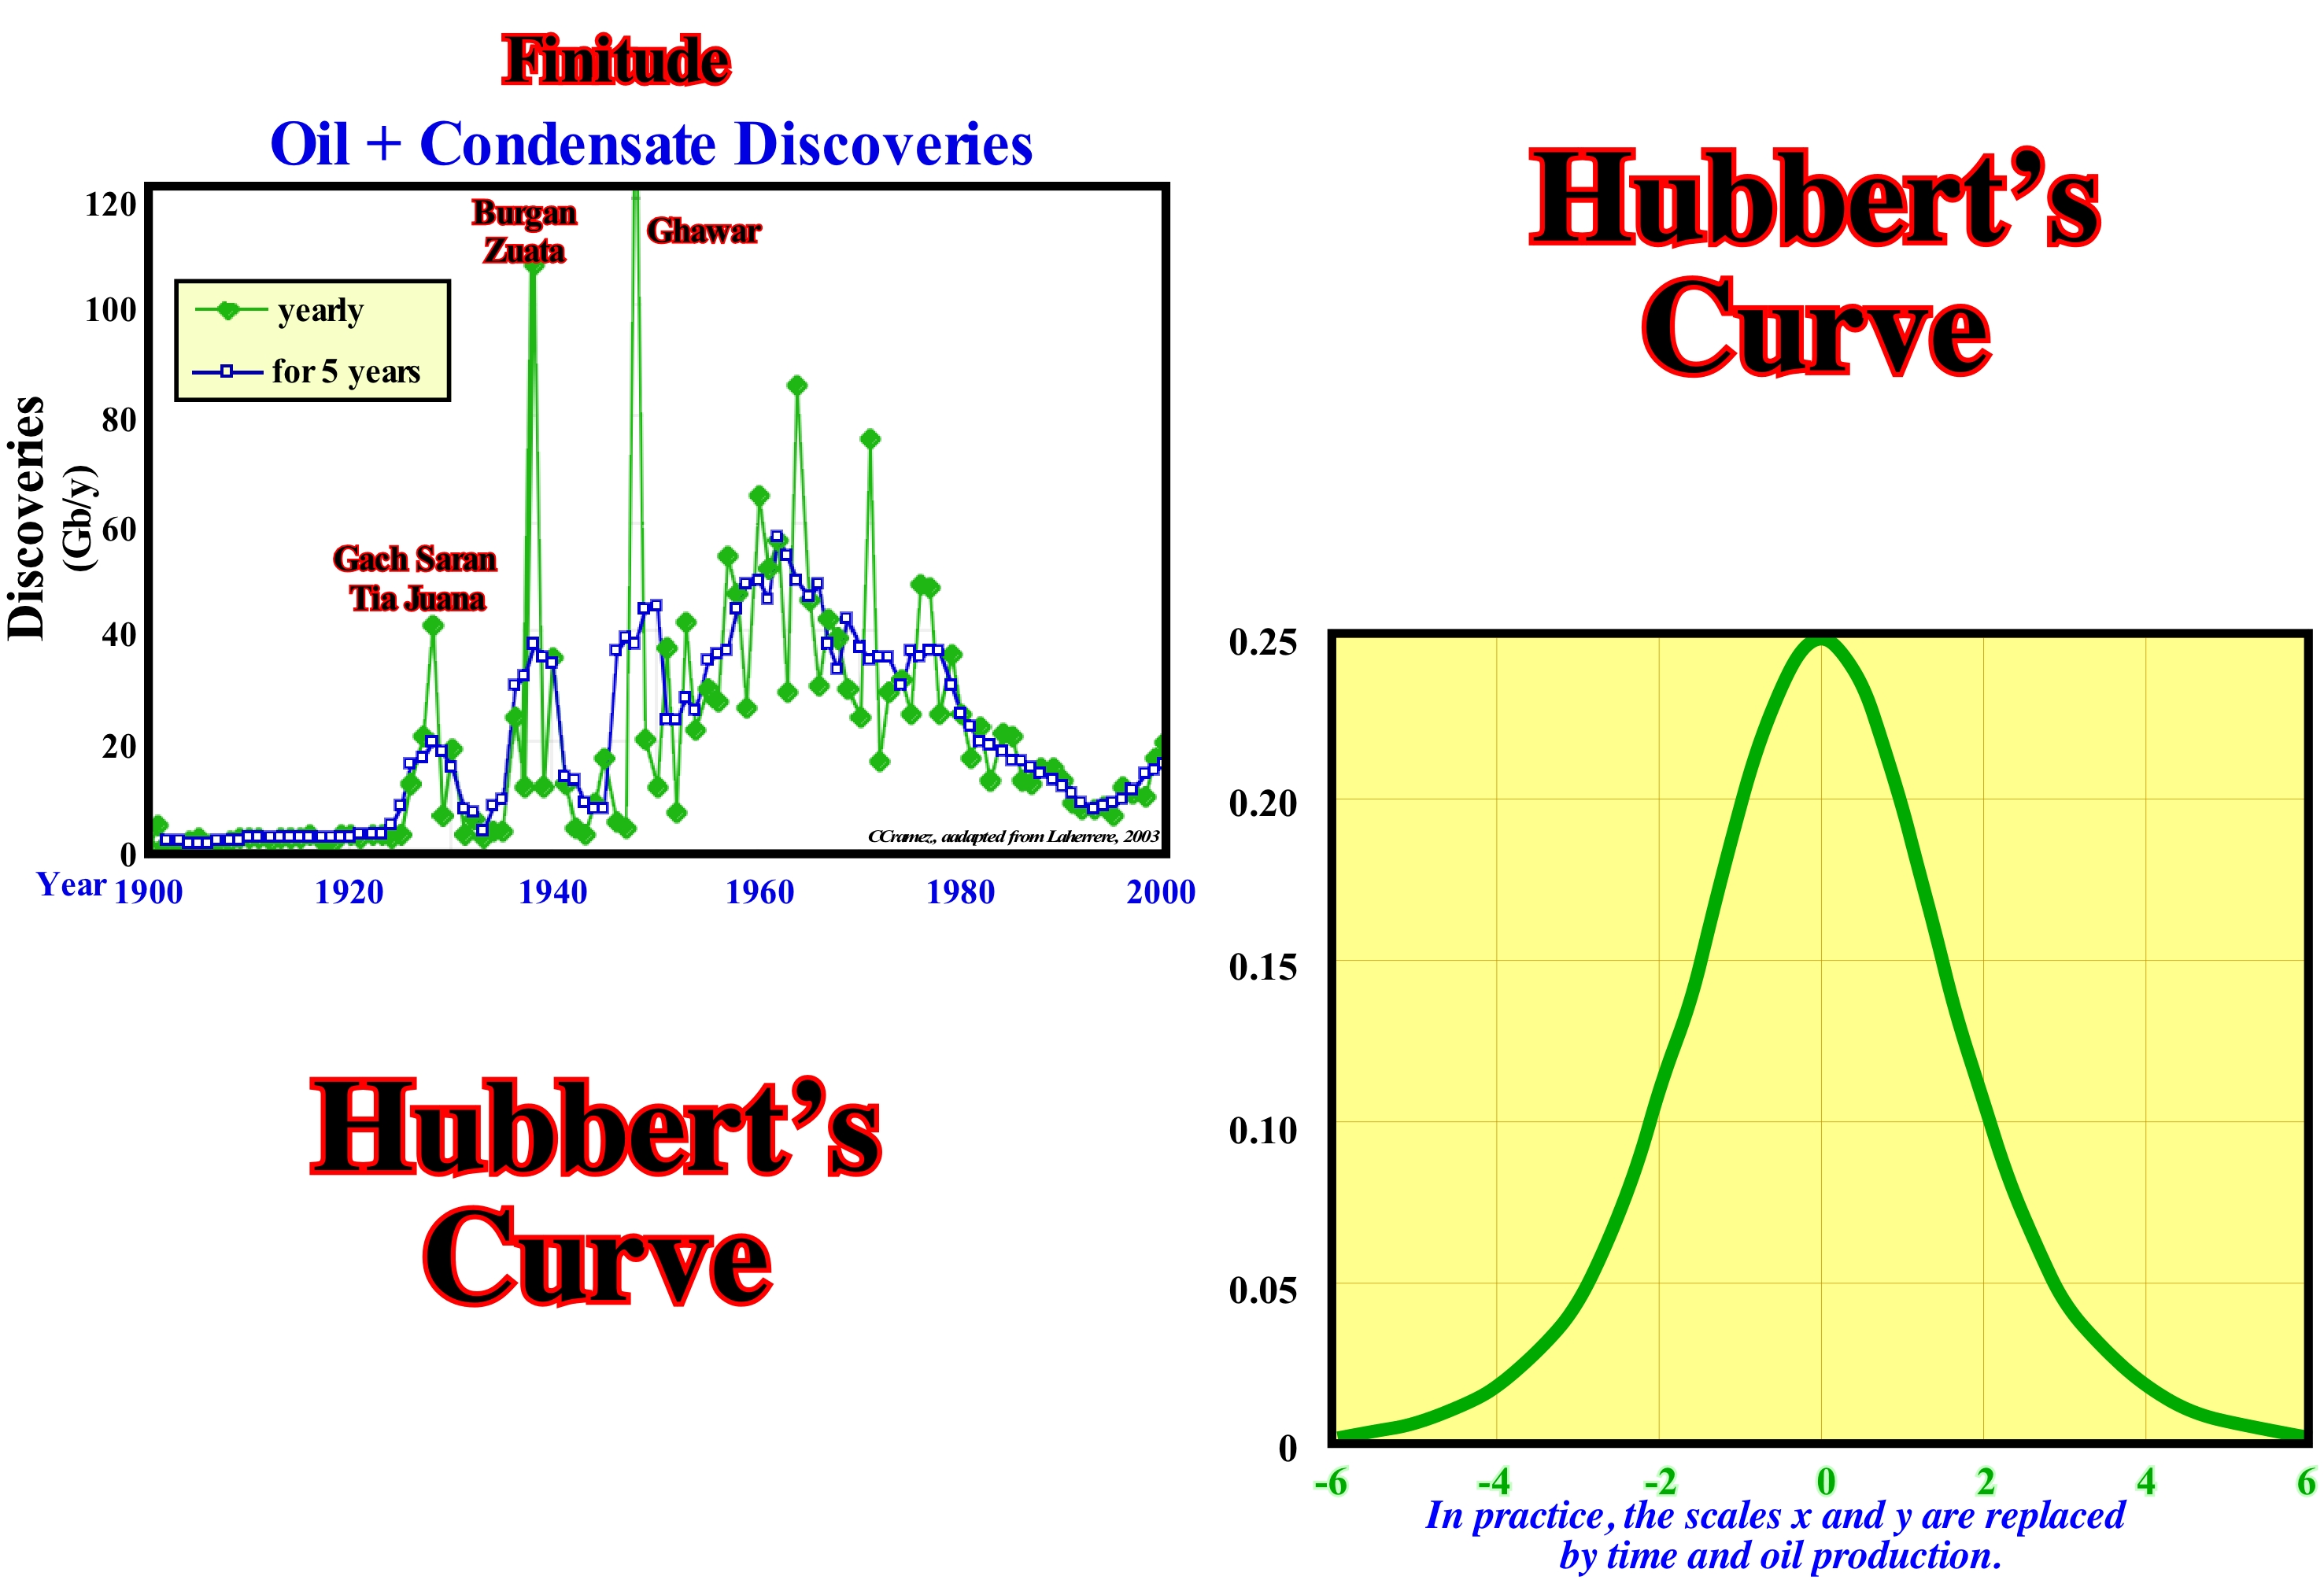
The Hubbert curve corresponds to the classical logistic curve, which was discovered by Verhulst, in 1845, when he studied population-related problems. Verhulst, used it, mainly, to show that a certain population grows to a certain point and then decreases to zero (S-curve). This type of curve can also be used to model cumulative oil production: Q = U / 1 + EXP b (t-tm), where "t" is the reference date (year), "Q" the cumulative production in the reference year t , "U" the final recovery, "tm" the date of the midpoint and "b" the factor that characterizes the slope of the curve. The Hubbert curve, also known as "peak oil", emphasizes the point (time) at which the oil production rate reached the maximum value. From this point on, which corresponds, roughly, to the production of half of the reserves, the production decreases. This concept that translates a logistic curve, was first observed in the production rate of the productive wells and then generalized to the total production rate of the oil fields. The same is true of oil discoveries. In the "Discoveries versus Time" diagram, illustrated in this figure, it is easy to see that, globally (at the global level), the peak oil discoveries plus condensate occurred around 1962. The three abnormal points correspond to the discoveries of : (i) Gachsaran (1939, Iran)/Tia Juana (1928/1930, Venezuela) ; (ii) Burgan (1938, Kuwait) / Zuata (1935/1938, Venezuela) and (iii) Ghawar (1948, Saudi Arabia). In this way, it has become apparent to almost all producers that the rate of production of an oil field, after growing exponentially (up to the peak rate) decreases, sometimes very rapidly, until the field is depleted. Subsequently, this concept was used for the oil basins and even, approximately, for the different producing countries, which does not have much geological sense. M. King Hubbert, in 1956, proposed conventional oil production for the United States (Alaska state excluded) would reach its peak between 1965 and 1970, meaning that half of the reserves would have already been produced. Oil production in the United States culminated in 1971, i.e., a year later than planned by Hubbert. The peak of the discovery of oil reserves in turn occurred in 1962 (Ivanhoe, L. F). Despite the fact that production peaks are difficult to predict and can just be reliably identified retrospectively, the most pessimistic assessments suggest a peak of oil between 2015-2020. The exact year of peak oil has not yet been accurately established, although the International Energy Agency (IEA) stated in November 2010 that oil production peaked in 2006. On the basis of current production data, the Association for the Study of the Peak of Oil and Gas ("ASPO"), has suggested that peak oil would have occurred in 2010, while that of natural gas will happen a few years later. The most optimistic estimates advance reserves for at least 100 years. The construction of a derivative curve from a logistic curve is, relatively, easy since the derivative of a point on a curve is the tangent at that point. If you have trouble understanding, imagine that you are driving during the night on the old road between Sierre and Crans-sur-Sierre. As the lights on your car indicate the derivative at each point of the road, it is easier to see if it goes down or goes up. The same is true of the derivative of the oil production curve. A growing number of geoscientists believe that the peak oil production has indeed arrived. After Hurricane Katrina (2005), Saudi Arabia admitted it could not increase production to compensate for production losses in the Gulf of Mexico. Many people think we are at the beginning of the final oil crisis. Final because this will be the last and it will require greater adjustments and greater cuts in consumption like never been done before. Moreover, the crisis is not limited to oil. Natural gas, in many places, is also reaching peak production, and globally, it will happen not long after peak oil.
Hubbert's Law (Oil peak, Hubbert's peak).......................................................................................................................Loi de Hubbert
Lei de Hubbert / Ley de Hubbert / Hubbert-Gesetz / 哈伯特的法律 / Закон Хабберта (пик нефтедобычи) / Legge di Hubbert /
The annual oil production rate depends, linearly, on the total oil fraction that has not yet been produced. The total amount of oil produced follows a logistic curve. The rate of production, at a certain point, is given by the rate of change of the logistic curve, i.e., by the derivative at that point in the curve, which is also called the Hubbert curve. Under normal conditions, when the oil production curve reaches its maximum, about half of the reserves have already been produced.
See: « Hubbert's Curve »
&
« Oil Peak »
&
« Hubbert's Peak »
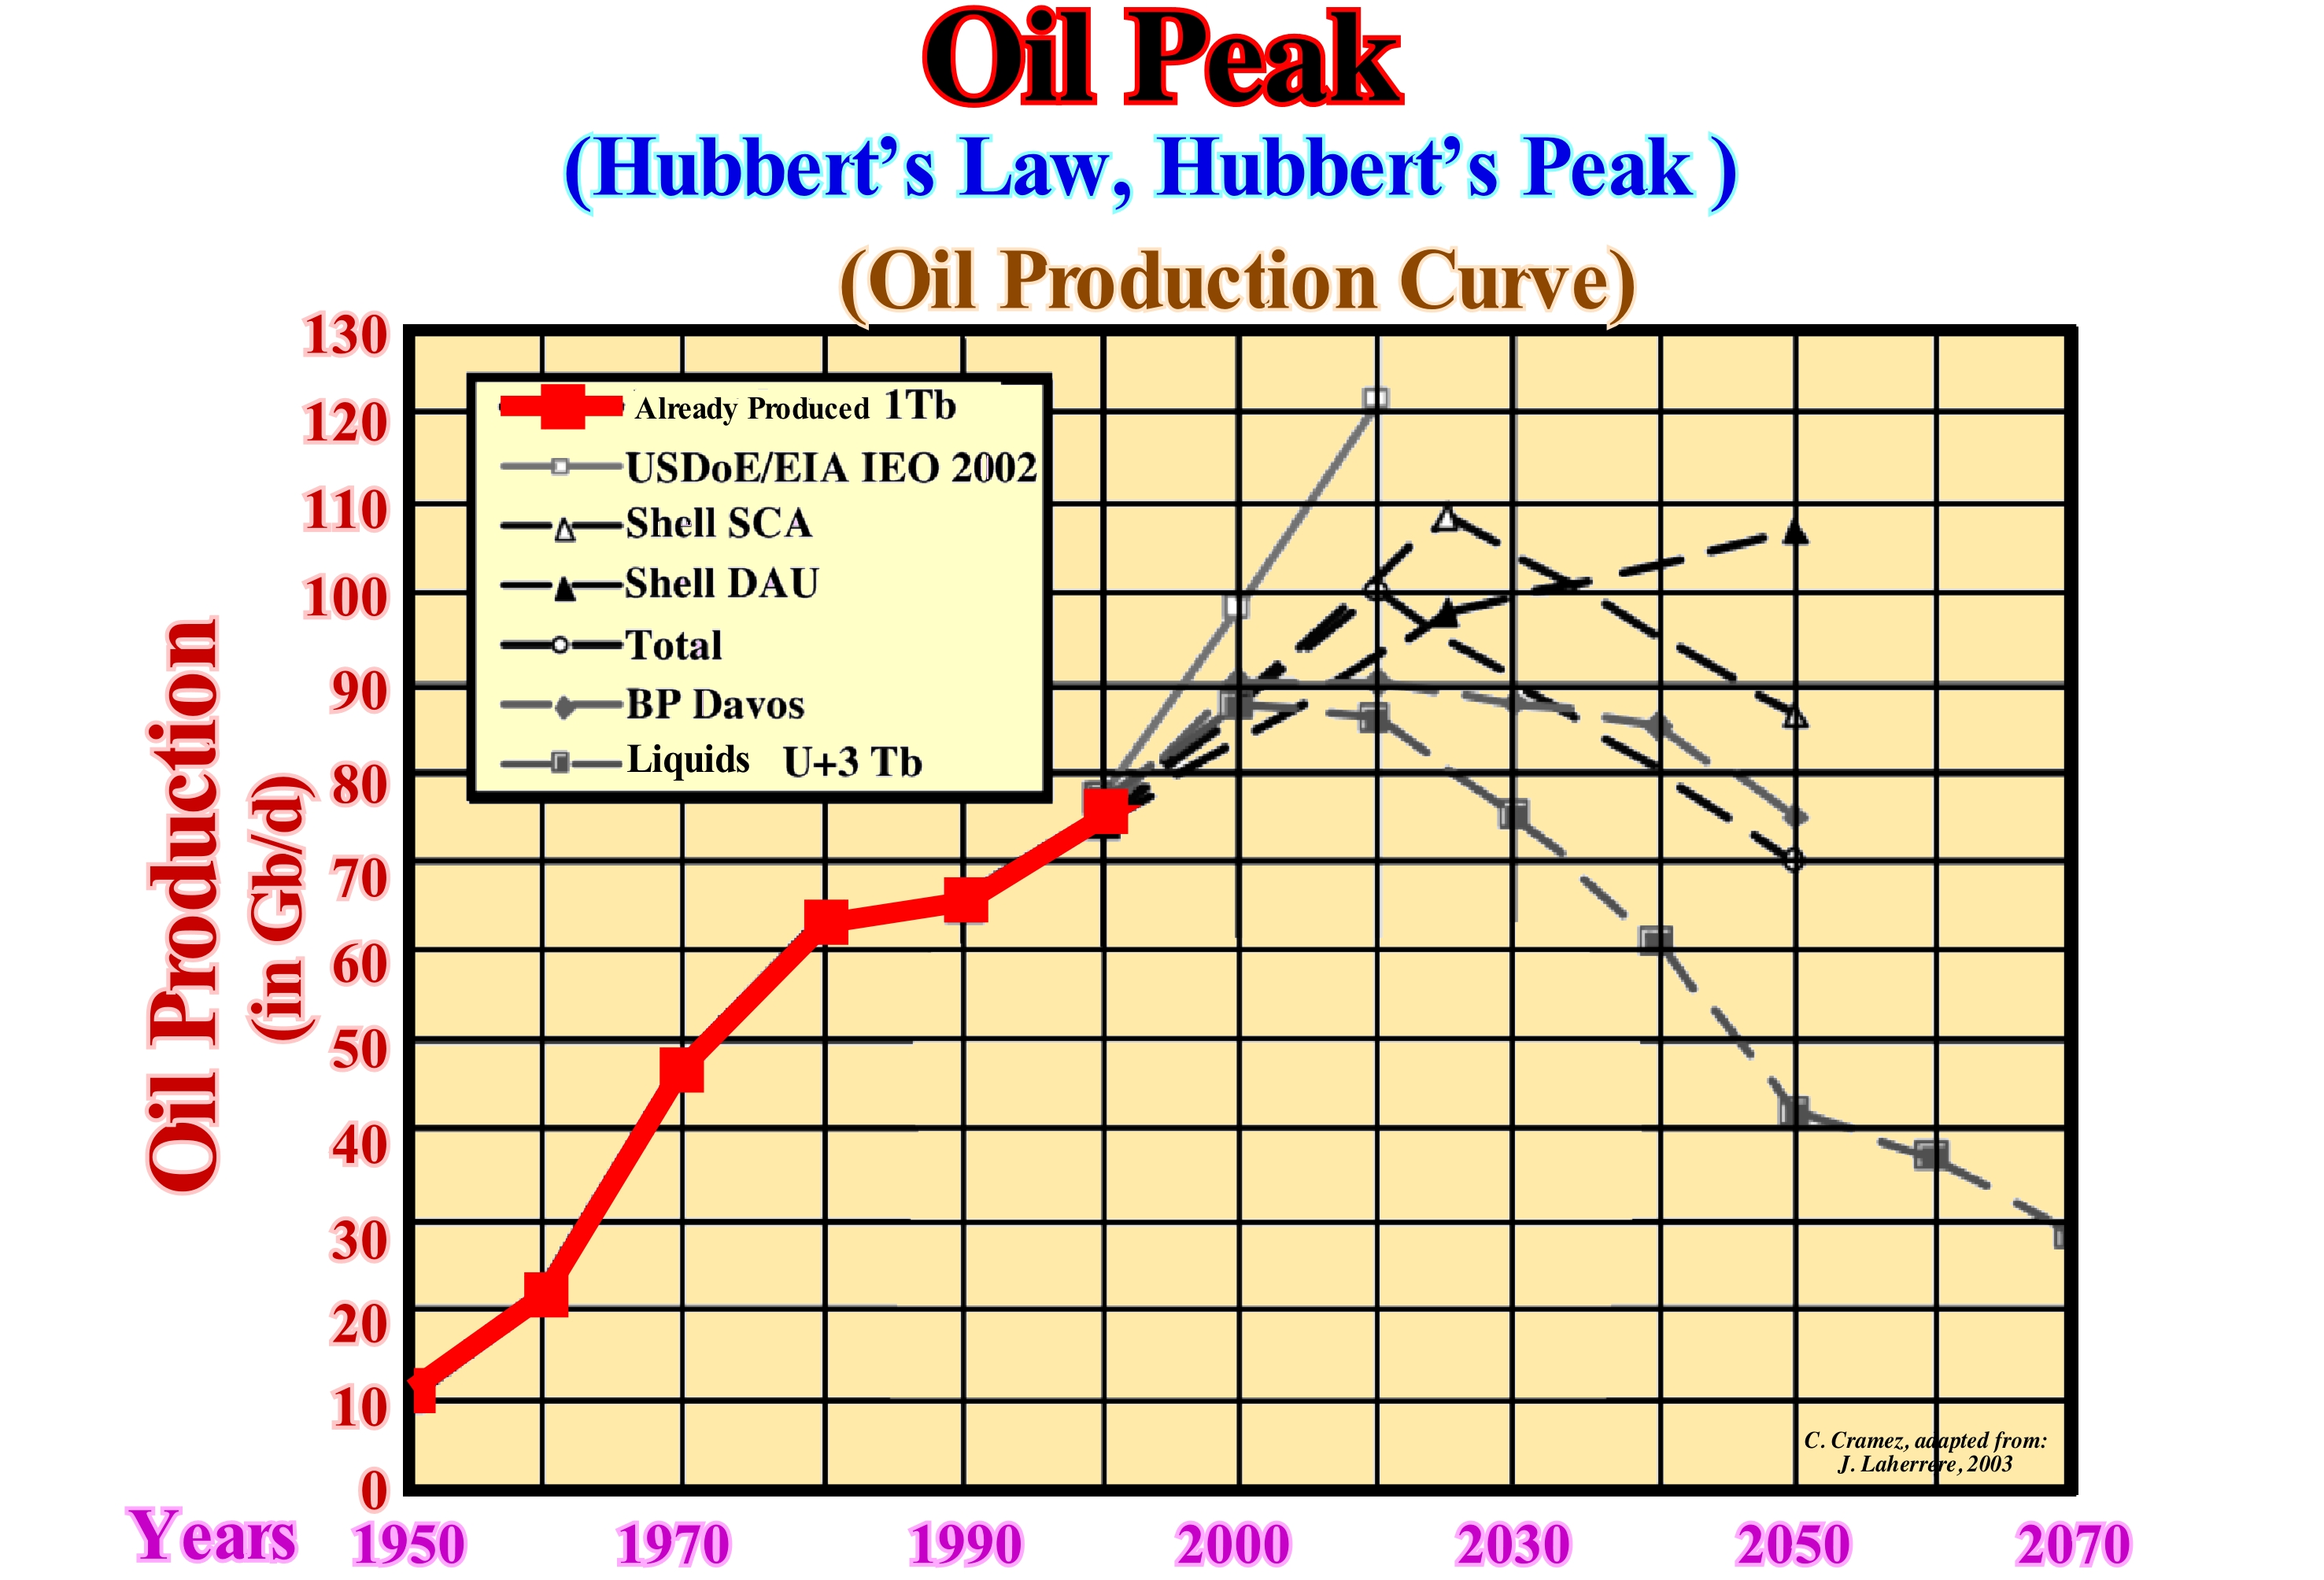
In this diagram proposed by J. Laherrere in 2003, it is easy to see the difference between the political estimates (oil companies and international organizations) and the estimates made from the technical data (Petroconsultants and IHS). For Laherrere, as well as for most geoscientists, who have the technical data, peak oil production is reached, if not already, by 2010 (regardless of the decrease in production induced by present economic crisis). However, for some oil companies such as BP, peak oil production will only be achieved by 2020, while others (Shell DAU) do not peak before 2050, not to mention USDOE/EIA, which continue to see oil production increase (lack of knowledge of the laws of nature, such as the law of Finitude). The area under the curves, that is, the integral* of the curves is equivalent to the accumulated oil production. Due to symmetry (another law of nature), relative to time, peak oil production occurs when the area under the curve has reached half of the accumulated production. It is, relatively easy, to calculate the amount of oil in an oil field before starting production. Do not forget that only about 1/4 of the total oil is recovered during the primary recovery. Later, during a secondary recovery, about half of the oil is still in the reservoir. Likewise, since the water enters the rock-reservoir, the oil droplets are, practically, isolated and most of the oil is not recoverable. Therefore, the production price of the remaining half of the reserves will not be the same. Cheap oil is gone.
(*) The differential calculus considers the relation between parts of a geometrical figure when parts become infinitely small. The integral calculus has an exactly opposite task: the integration of infinitely small parts onto geometrical figures of final size. (G. Gamow, 1962).
Hubbert's Peak (Oil peak, Hubbert's law).......................................................................................................................Pic de Hubbert
Pico de Hubbert / Pico de Hubbert / Hubbert-Peak / 哈伯特峰值 / Пик Хабберта / Picco di Hubbert /
Peak of the oil production curve, which in the United States was reached in the early 1970s, following Hubbert's model, in which oil reserves would be exhausted before the twenty-first century. When Hubbert made his prognosis, he formulated no equation. Its famous bell-shaped curve, now called Hubbert's Curve, was drawn by hand. It was only in 1985 that he used the equation of the derivative of a logistic curve to describe his antiform geometry. Synonym wit Oil Peak or Hubbert's Law.
See: « Petroleum »
&
« Logistic Curve »
&
« Reserves »
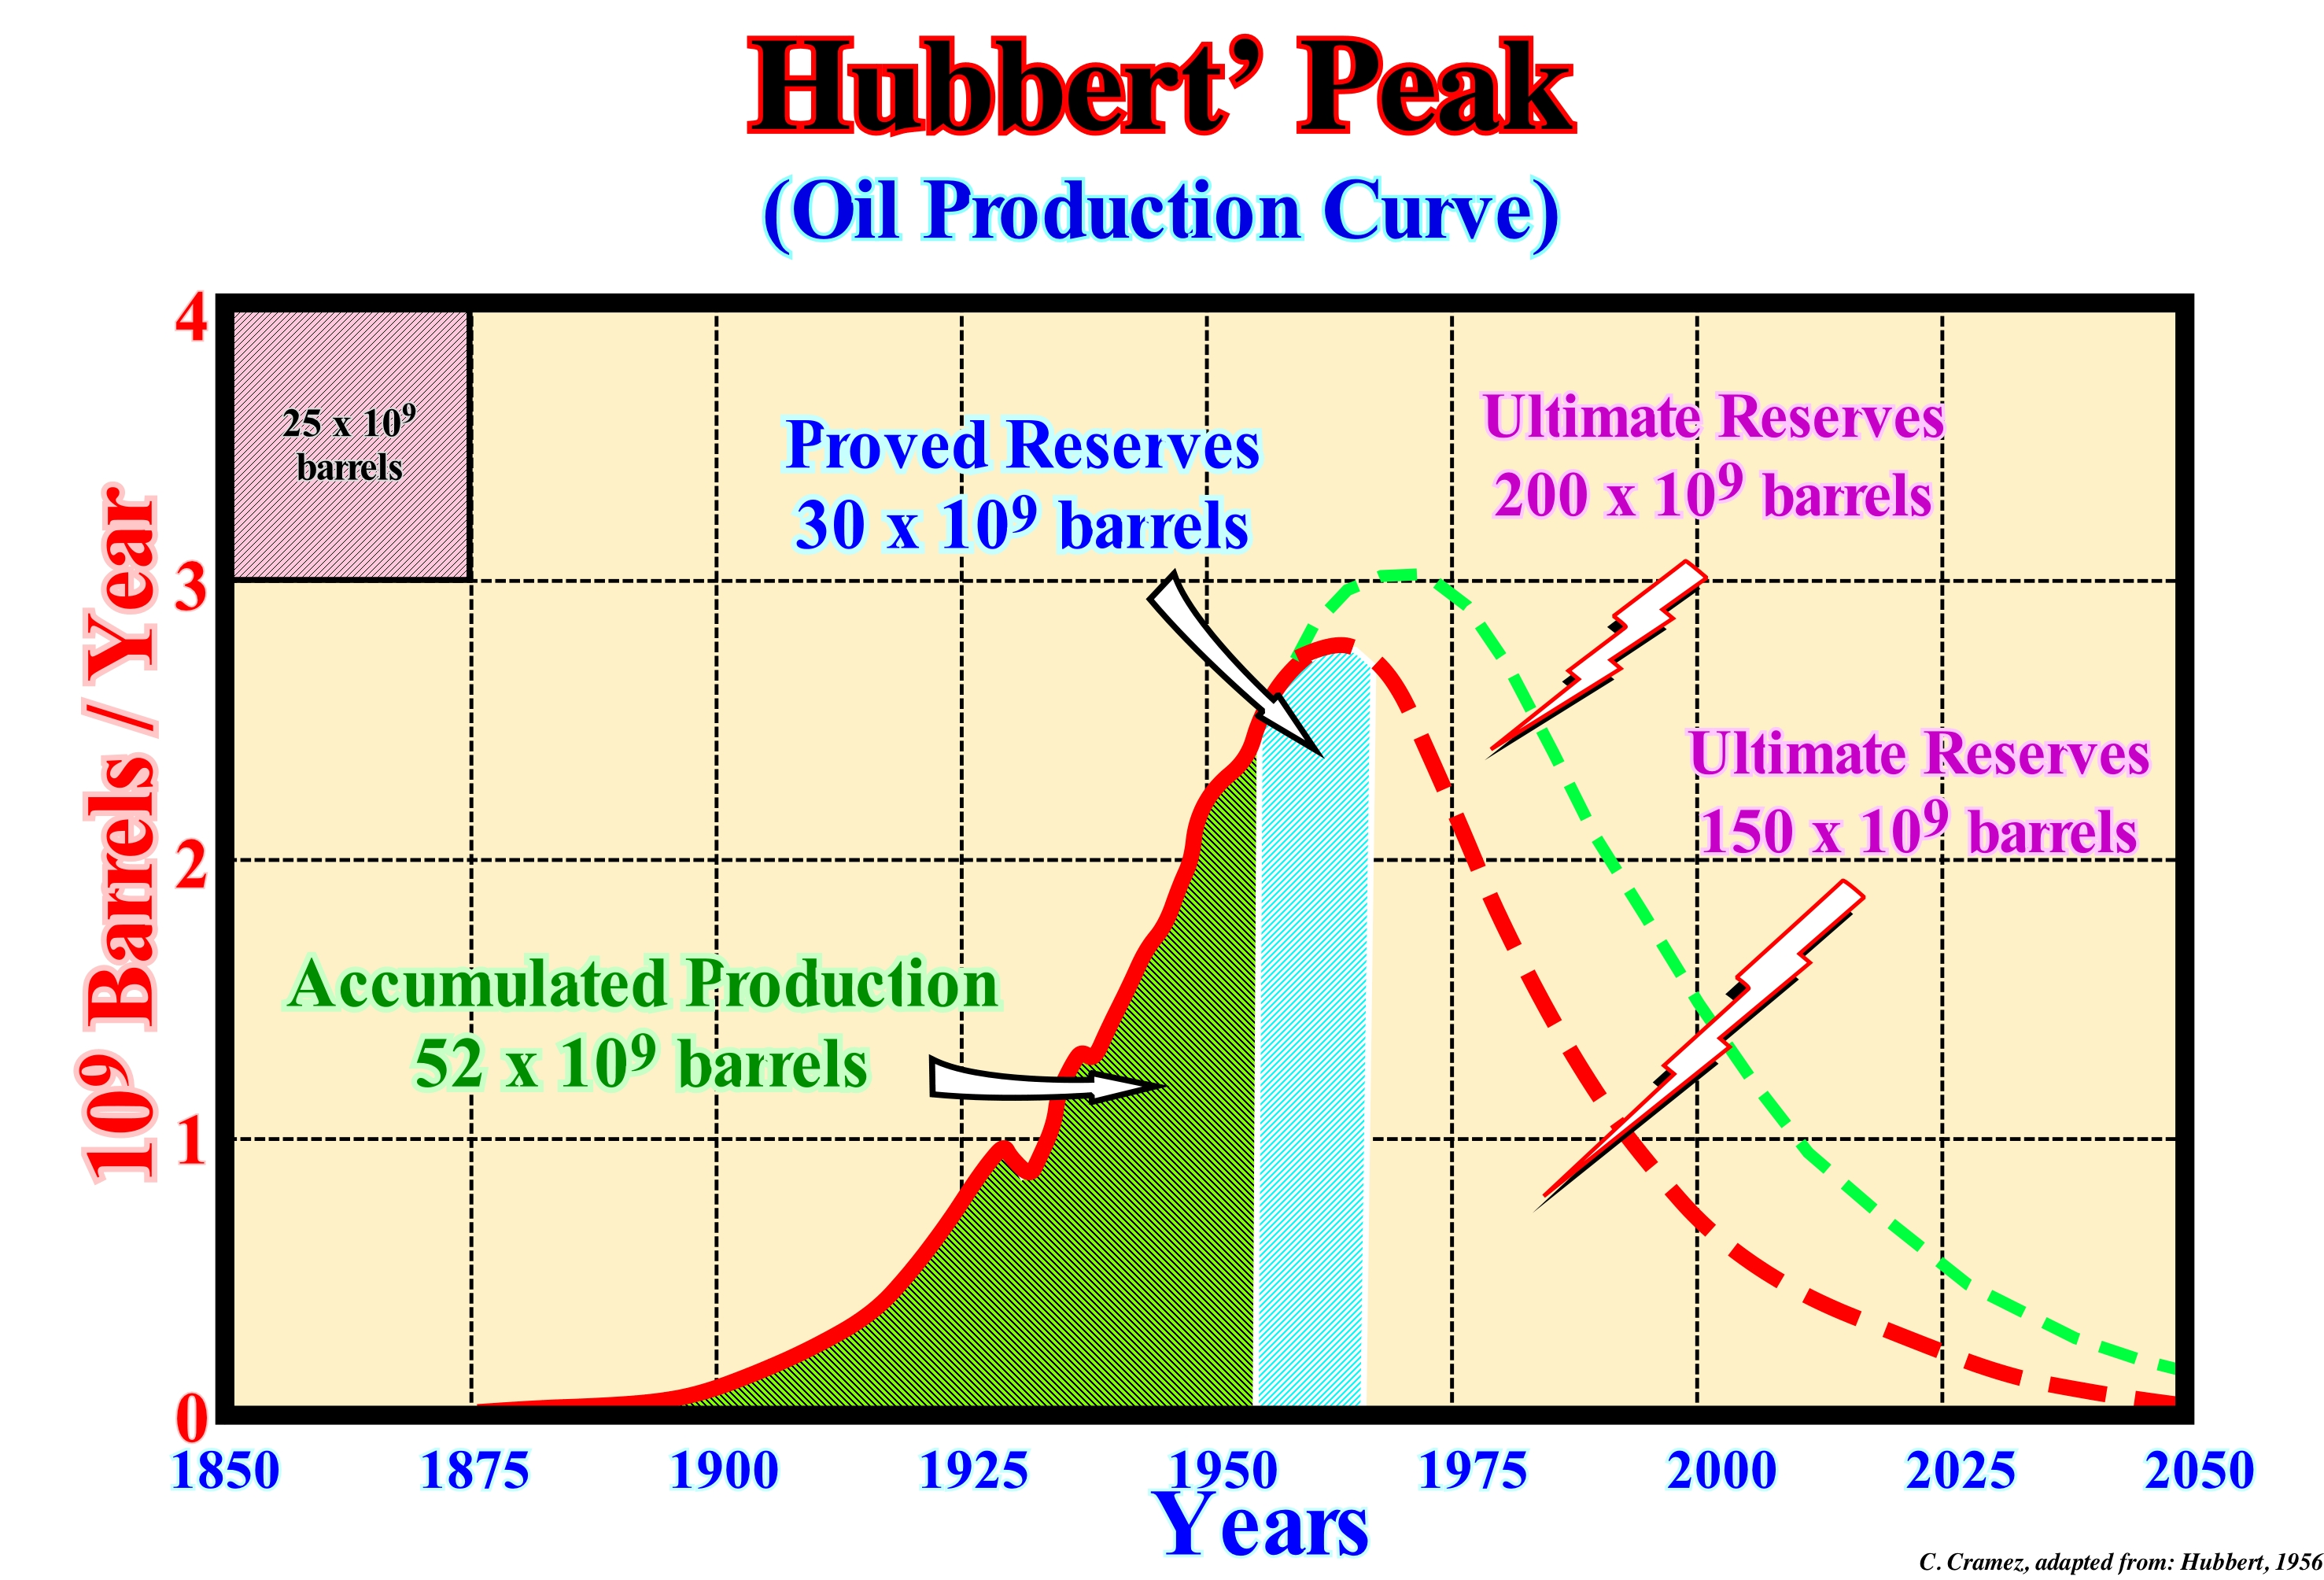
Based on initial reserves, Hubbert (1956) predicted 150 and 200 Gb (billion barrels) of final reserves for the US. Hubbert was right in one of his predictions. The maximum production was reached in 1970. However, it erred in several points: (i) The final reserves of 150 Gb (production maximum in 1965) were, greatly. underestimated ; (ii) The symmetric bell curve is valid only for the 48 Southern States (USA), where more than 20,000 producers act in a disordered manner and whose set has a normal behaviour (Gauss curve = Central Limit Theorem ). The production curve (US) shows a flatness around 1975, which corroborates the value of 230 Gb as ultimate reserves. Laherrere (2003) described the strengths and weaknesses of Hubbert's concepts and predictions. Strengths: (i) Natural model (everything born will die) ; (ii) Utilization of production and past discoveries, and geological estimation of final reserves ; (iii) Admission of geological uncertainty and use of two estimates of final reserves ; (iv) Admission that the production curve follows the curve of the discoveries with a certain lag. Weaknesses: (a) He did not propose any equation ; (b) Yearly production drawn by hand and the area under the curve represents the final reserves ; (c) The curve is not always symmetric (in this case the peak is not in the middle of the depletion) ; (d) Ignored "backdating" and average values ; (v) Did not make a difference between proved and expected values ; (e) Worked with final values (impossible to compare discoveries and production) ; (f) Based on final estimates ; (g) Considered only a peak (in some countries there are two or more) and finally (h) Ignored the influence of economics and politics on the rate of oil production.
Hubble's Constant............................................................................................................................................................Constante de Hubble
Constante de Hubble / Constante de Hubble / Hubble-Konstante / 哈勃常数 / Постоянная Хаббла / Costante di Hubble /
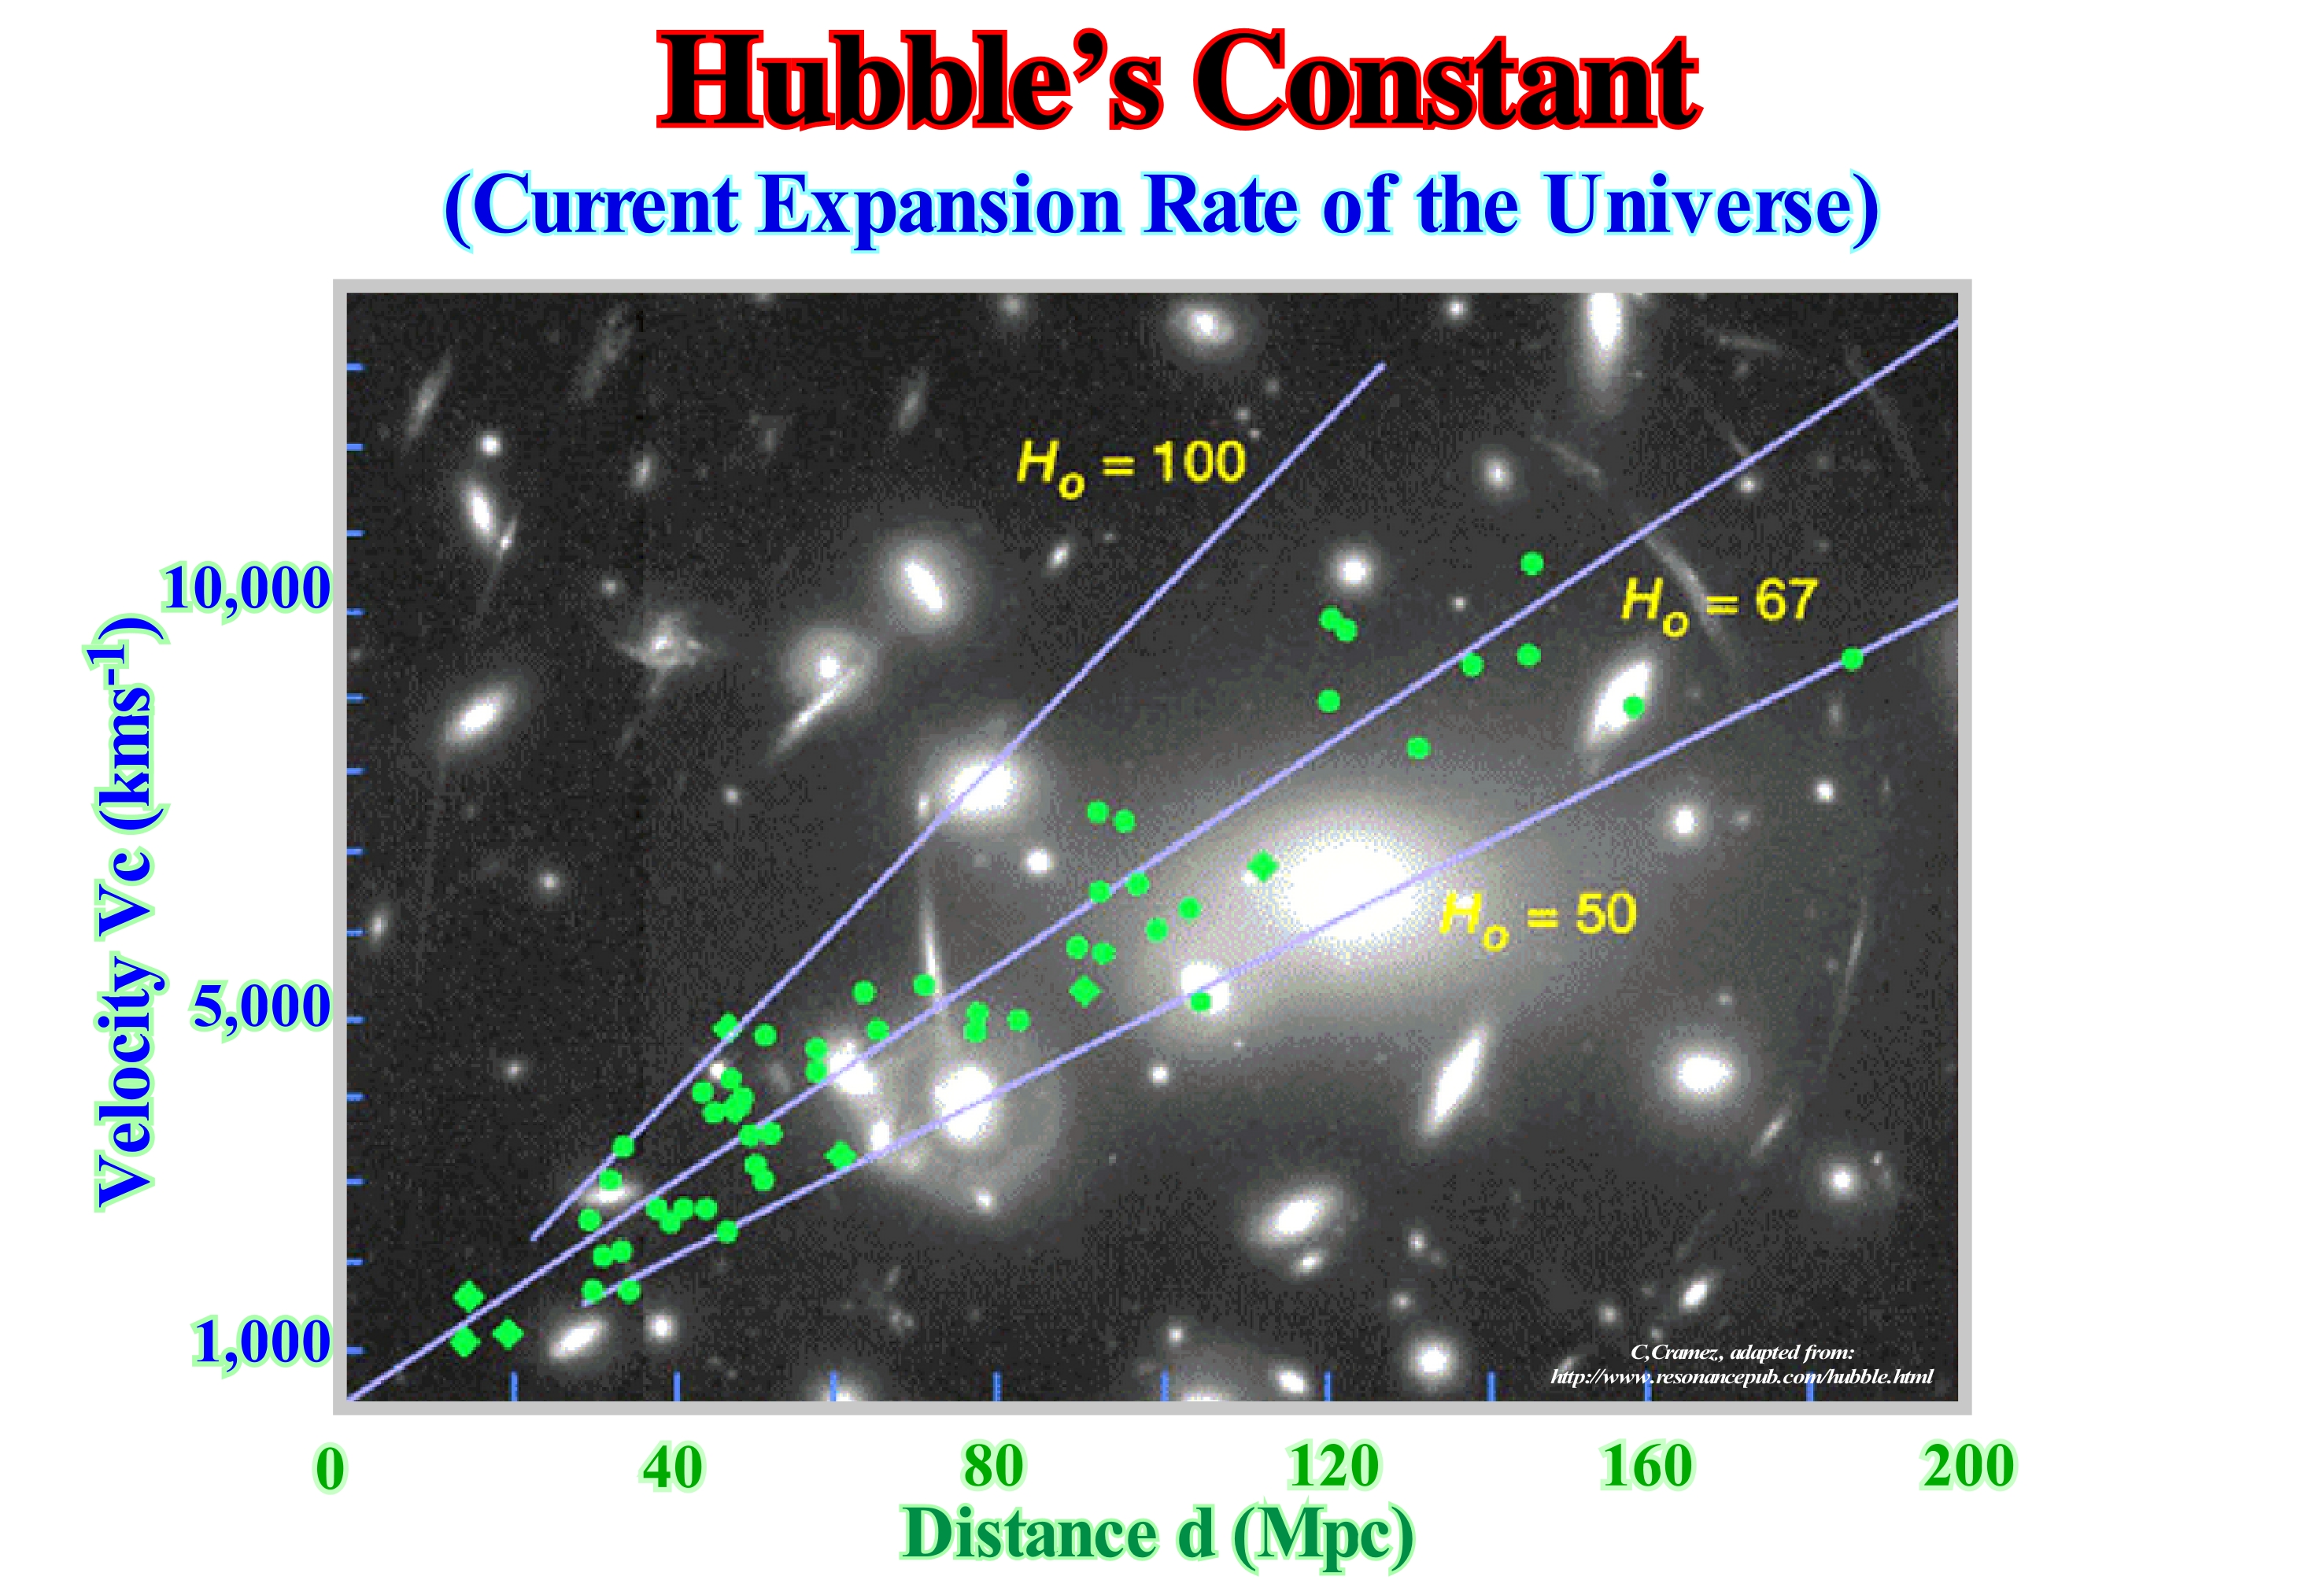
Number that measures the rate at which the Universe expands. Due to the inherent uncertainties in measurements of distances between galaxies, the Hubble's constant is uncertain of a factor close to ± 2. Some geoscientists think that the Hubble's constant is close to 50 (for a universe age of about 15-20 Ga) while others think it can be close to 100, implying an age of the universe between 7 and 10 Ga.
See: « Universe (age) »
&
« Big Bang (theory) »
&
« Inflationary Universe »
The most recent calculation of the Hubble's constant was obtained in 2010, based on observations of gravitational lenses* from the Hubble Space Telescope, was 70.6 ± 3.1 (km/sec)/Mpc. Parsec, i.e., "pc" is the parallax of an arc / second, which is one unit in length, equivalent to just under 31 trillion kilometres or, more or less, 3.26 light years. In 2009, also using the Hubble Space Telescope obtained a value of 74.2 ± 3.6 (km/s)/Mpc. These results are in agreement with the first measures, obtained in 2001, that were of 72 ± 8 km/s/Mpc. In August 2006, a value of 77 (km/s)/Mpc, with an uncertainty of plus or minus ± 15%, was obtained using data from NASA's Chandra Player laboratory. NASA summarized the data suggesting a constant of 70.8 ± 1.6 (km/s) / Mpc for a flat space, or 70.8 ± 4.0 (km/s) / Mpc for a nonflat space. Thus, it can be said that the current observations roughly agree to a value around 73 (km/s) / Mpc. This means that a galaxy situated at about 1 megaparsec, that is, about 3.26 million light years from an observer, moves away from the observer due to the expansion of the universe at a speed of 73 km/s. An a priori surprising consequence of Hubble's law (galaxies move away from each other at a rate commensurate with the distance between them) is that a galaxy that lies more than 4,000 Mpc (14 x 09 light-years) moves away from we at a speed higher than the speed of light, which suggests that the interpretation in terms of motion of the galaxies becomes unfit for great distances. General relativity explains that we must consider that we are dealing with an expansion of space itself.
(*) Space-time distortion caused by the presence of a large mass body between a star and an observer.
Hubble's Law.........................................................................................................................................................................................................Loi de Hubble
Lei de Hubble / Ley de Hubble / Hubble-Gesetz, Hubble-Konstante / 哈柏定律 / Закон Хаббла (закон красного смещения) / Legge di Hubble /
The distance of the galaxies varies in proportion to the redshift, and thus by the Doppler effect *, and their escape velocity. The idea of an expanding Universe is based on this idea, which with the observation of fossil radiation are the ring stones of the Big Bang theory**. The speed at which galaxies move away from the Earth is proportional to the distance that separates them from the Earth. This law can be translated by the equation v = HoD, where v is velocity, D is the distance and Ho is the Hubble constant (velocity in km/s of a galaxy far from the Earth of a Megaparsec). The reciprocal of Ho is the time of Hubble.
See: « Megaparsec »
&
« Hubble's Constant »
&
« Inflationary Expansion (theory) »
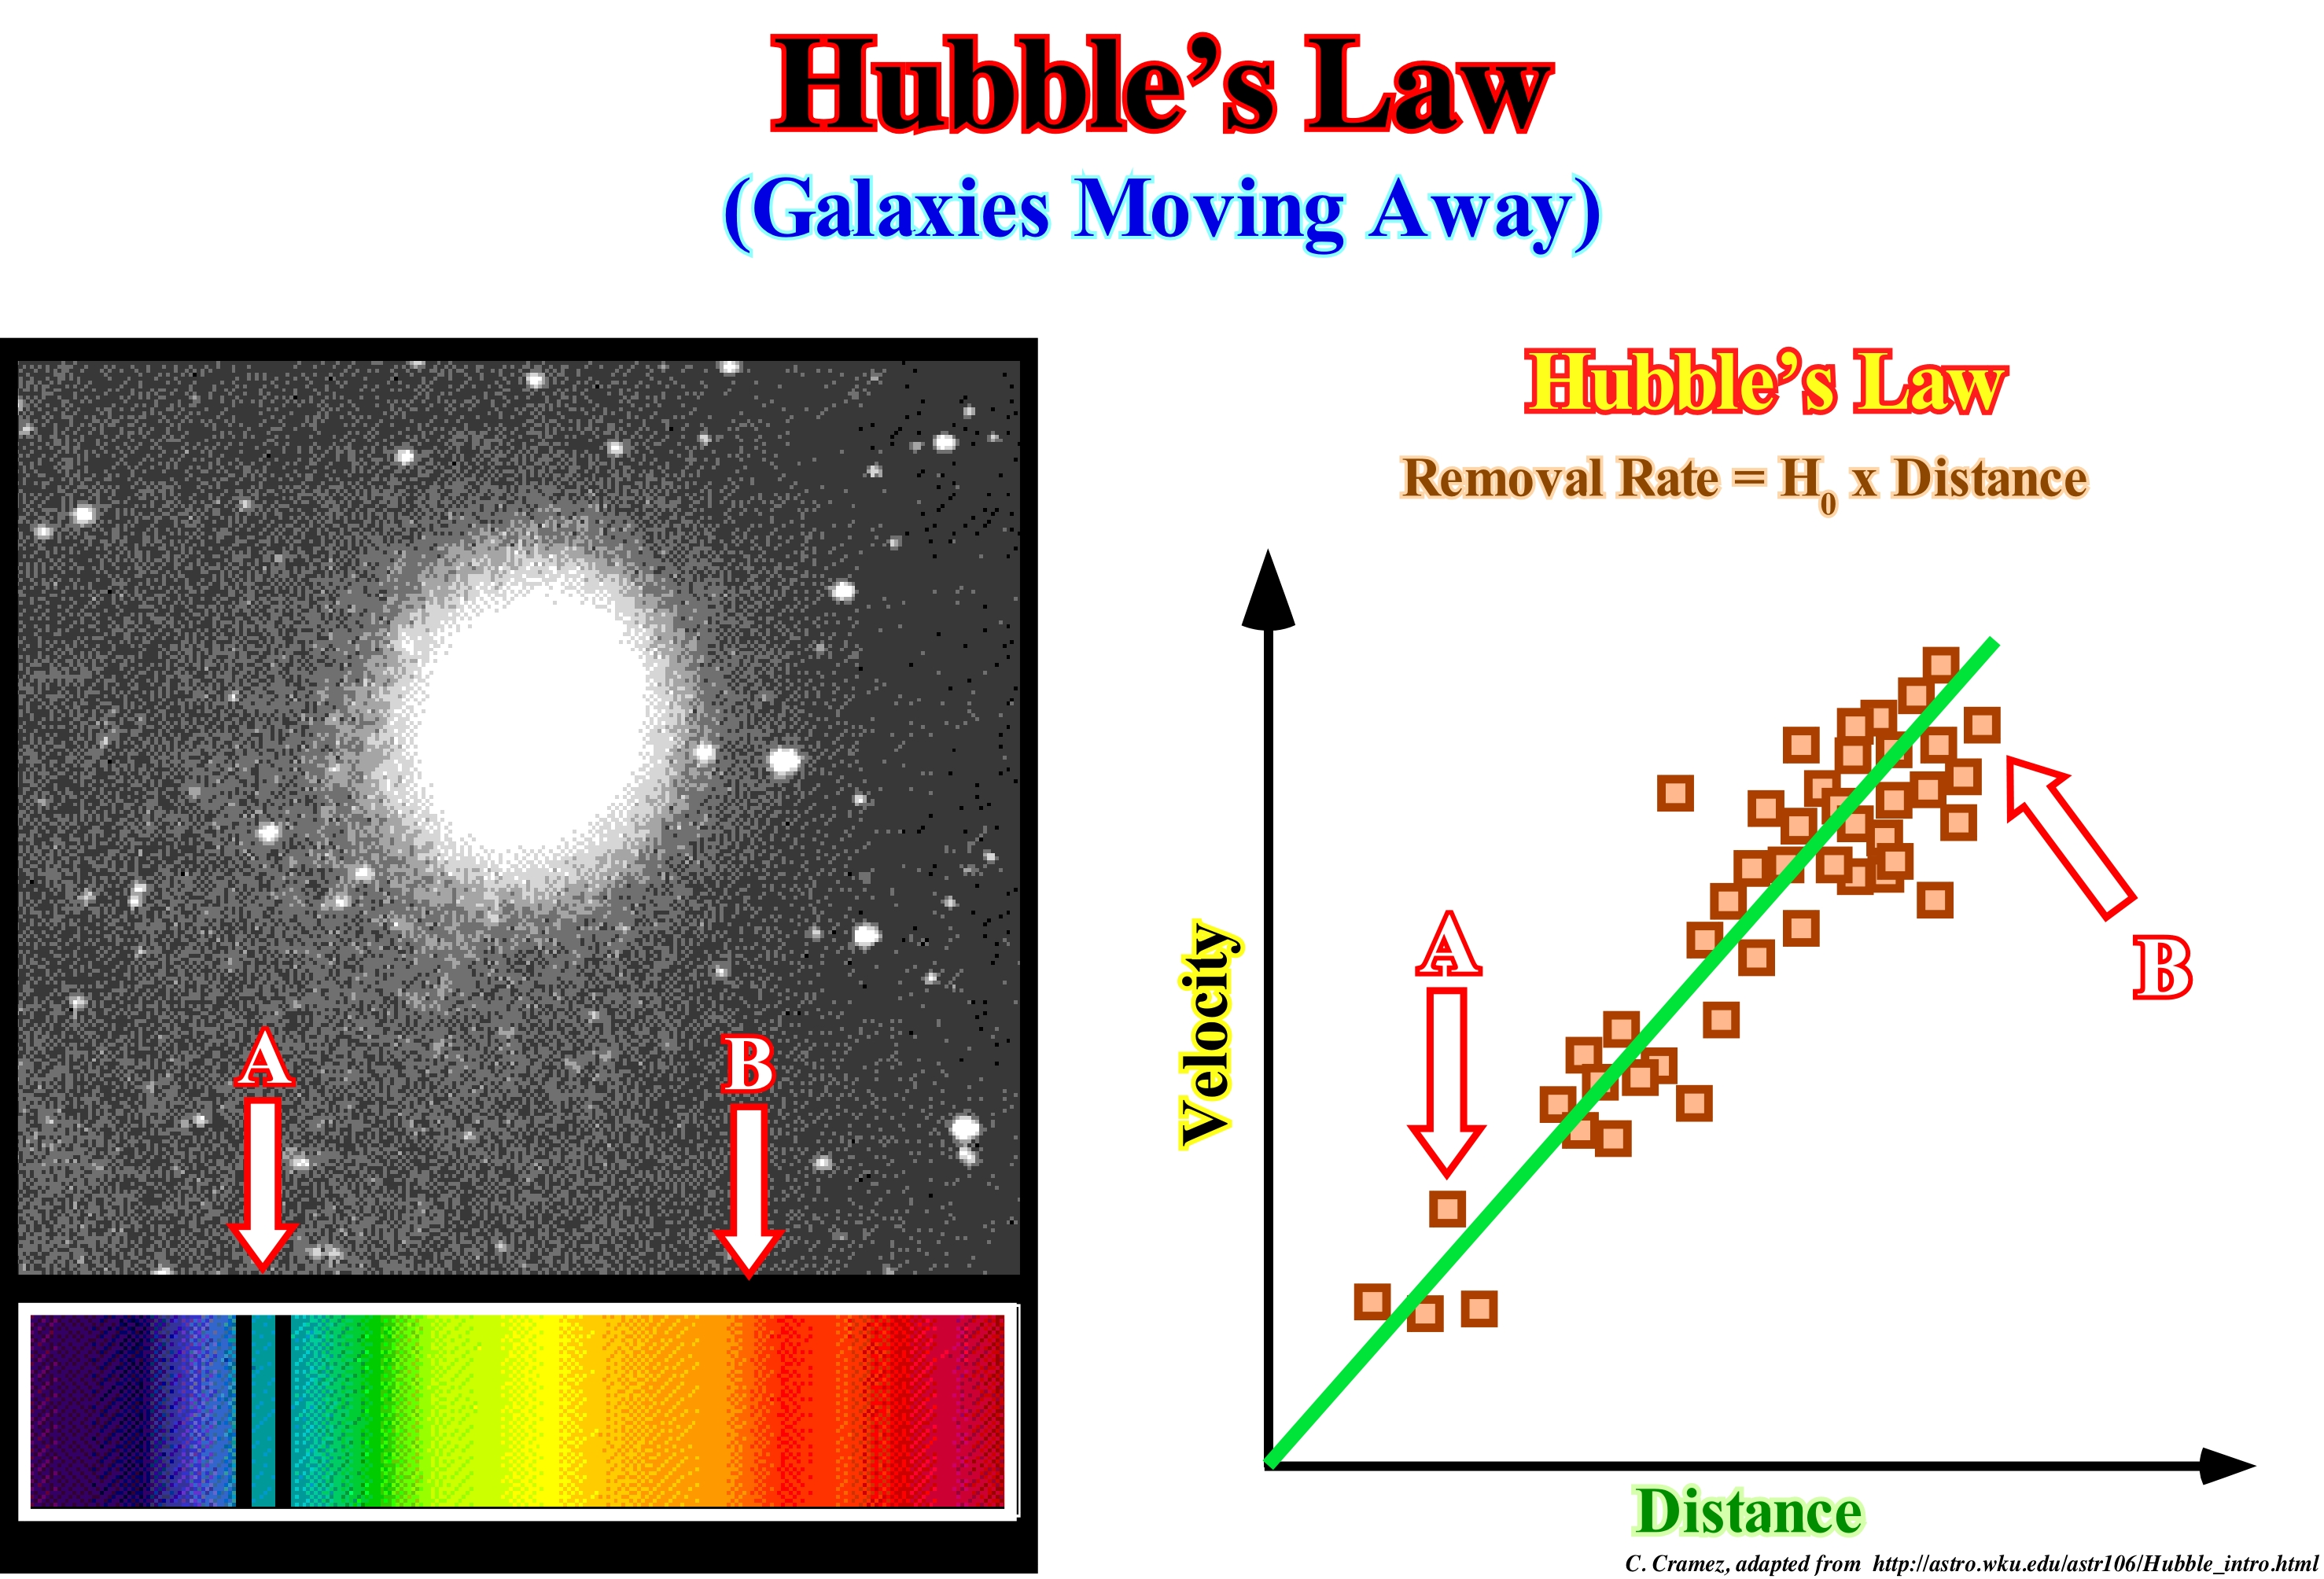
As illustrated in this figure, the galaxies are moving away from each other and at an ever-increasing rate. The farther away the galaxy is, the faster it gets away from us***. This means that the Universe is expanding like a balloon. Hubble's law says that the velocity of galaxies in relation to their distances is constant. This constant is known as Hubble's constant, which is the current rate of expansion of the Universe, i.e., around 73 (km/s) / MPC). In other words, a galaxy situated 1 mega-parsec (about 3.26 million light years) away from an observer moves away due to the expansion of the Universe (outside the effect of the object's own movement, neglected at a great distance) at a speed of 73 km/s). This constant is known as Hubble's constant. It corresponds to the current Universe expansion rated, which is around 22 kilometers per second per million light-years (unit length, equivalent to, approximately, 10 trillion kilometers, i.e., 1016 metres (10 peta-metres). The inverse of the Hubble's constant would be equal to the age of the Universe if it did not decelerate during its expansion. The deceleration constitutes an upper limit to the age of the Universe. The measure of the Hubble 's constant gives the Universe an age between 10 and 20 Ga. As defined by the International Astronomical Union, a light-year is the distance that light travels in a vacuum in a year. Currently, geoscientists know more than 125 billion galaxies in the observable Universe and each galaxy contains one billion stars. Their diameters range from several thousand to a hundred thousand light-years. But we can just know the galaxies that are within a certain radius, known as the Hubble's radius. Galaxies larger than the Hubble's radius travel at the speed of light. The Hubble's radius is estimated to be about 12 billion (109) years/light. The Hubble's radius is, often, simply called the horizon since it is closely related to the particle horizon (maximum distance that particles could have travelled in relation to an observer who has the age of the universe). The Hubble's radius is related to the Hubble's constant (H), since R = c / H, where "c" is the speed of light, which, roughly, means the volume of the Universe. As the Universe is, continually, expanding, its energy density is continuously decreasing (in the absence of exotic matter, like phantom energy).
(*) Variation of the energy and colour of light (or sound) due to the relative movement of the light source (or sound) relative to an observer. If the light goes away, the energy decreases and the light is shifted to red (the sound becomes more bass). As the source is approached, the energy increases and the light is shifted to the blue (the son grows sharper).
(**) The cosmological theory according to which the primordial Universe, extremely hot and dense, would have begun its existence by an enormous explosion that would be produced 10-20 billion years ago (109), in the whole point of space. This expansion would have marked the beginning of an expansion that still continues.
(***) If the rate of expansion of the Universe was uniform, its value has not yet been definitively determined. It is probably 18 km/s per million light-years away. Theoretically, this means that two galaxies distant of 1 million light-years away from each other at the speed of 18 km/s, and that two other galaxies separated by a distance of 2 million light-years away from each other at the speed of 36 km s. In other words, the further apart the galaxies are, the greater the velocity of expansion between them. The value of 18 km/s/106 light years is called the Hubble constant. In fact, galaxies that are part of a cluster or cluster of galaxies do not expand because they are strongly linked by gravity. What expands is the space between them.
Humification............................................................................................................................................................................................................Humification
Humificação / Humificación / Humifizierung / 腐殖化 / Гумификация (образование гумуса) / Umificazione /
Degradation of the organic material of a soil, which causes that some horizons of the soil become brown or even black.
See: « Soil »
&
« Humus »
&
« Organic Matter (types) »
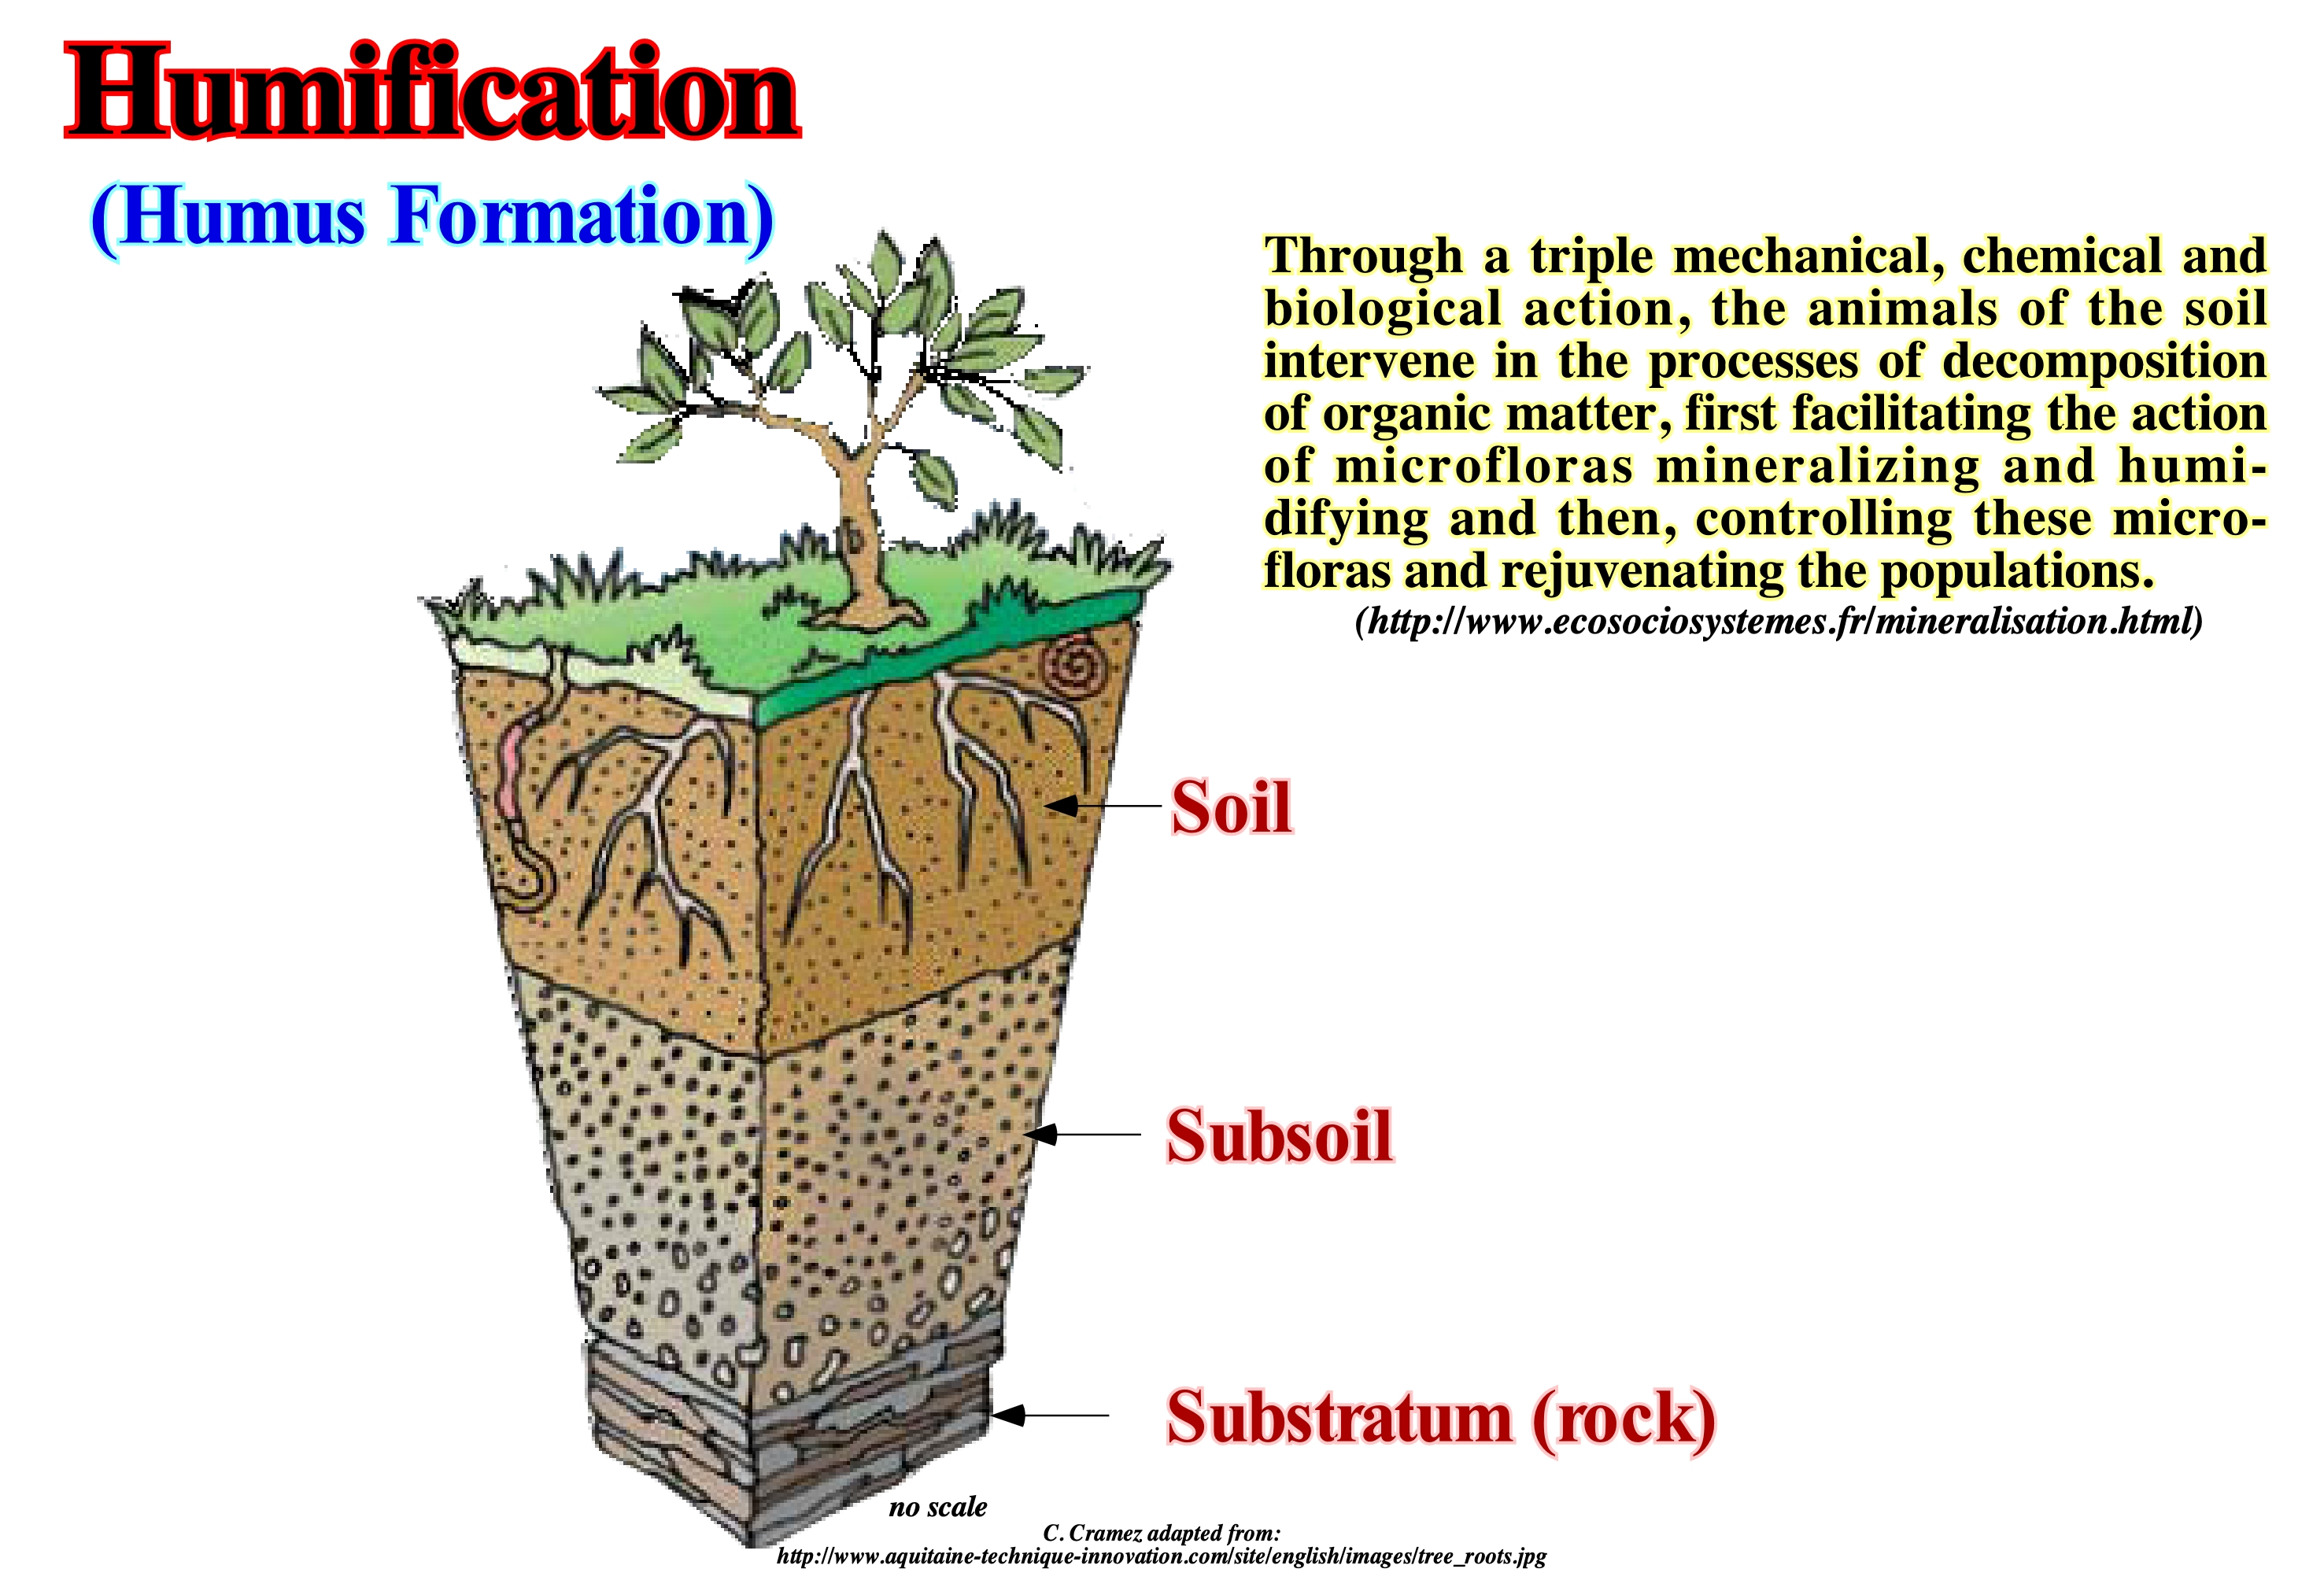
Humification is the process of transformation of organic matter into humus, under the influence of micro-flora and micro-fauna. It succeeds the decomposition of organic debris. New molecules developed by microbial and physic-chemical (neosynthesis). Schematically, the formation of a soil can be divided into three phases that overlap, more or less, in time: (i) Alteration, that is, the decomposition of rocks; (ii) Humification, i.e., the introduction of organic matter (humus) and (iii) Differentiation that translates migrations and the accumulation of many elements. The decomposition of the rock (soil source- rock) provides a material, more or less, mobile (pedologically the parent rock), which is, gradually, colonized by increasingly differentiated vegetation. This brings back into the ground a more or less significant amount of waste, which transformation gives rise to humus. Some components of humus, in association with the movements of water in the soil, can cause displacement of substances (migration), bringing the appearance of overlapping layers, some poor and others rich in such substances. These layers are the horizons, which together constitute the soil profile. The horizon A is the surface horizon with organic matter (plant remains). The horizon C corresponds to the little or slightly altered rock and the B horizons are the intermediate horizons that appear in the evolved soils. Soils are immature or poorly evolved with AC profile, while soils evolved have an ABC profile. B horizons are formed by the weathering of rocks or by the movements of matter from horizon A. A soil is a change film covering a rock. It is formed by a mineral fraction and organic matter (humus). A soil forms from the rock, but then it evolves under the influence of environmental factors, especially, the climate and vegetation. Certain geoscientists think in the process of humification there are rhythms independent of temperature, humidity, light, variations in atmospheric pressure, micro-flora and seasonal chemical variations. They think certain factors of electrical origin and solar activity (indirectly) may be responsible for such rhythms.
Hummocky Clinoform Configuration..............Configuration clinoforme mamelonnée
Configuração clinoforma mamelonada/ Configuración clinoforme mamelonada / Hügelige clinoform Konfiguration / 丘状clinoform配置 / Клиноформный холмистый рельеф / Configurazione clinoforme pustolosa (ruvida), Configurazione clinoforme hummocky /
Set of more or less discontinuous and wavy seismic reflectors, often with opposite slope, interpreted as strata associated with turbidite deposits, usually, turbidite slope fans (filling of channels or depressions and levees).
See: « Stratal Patterns »
&
« Reflection Configuration »
&
« Submarine Slope Fan »
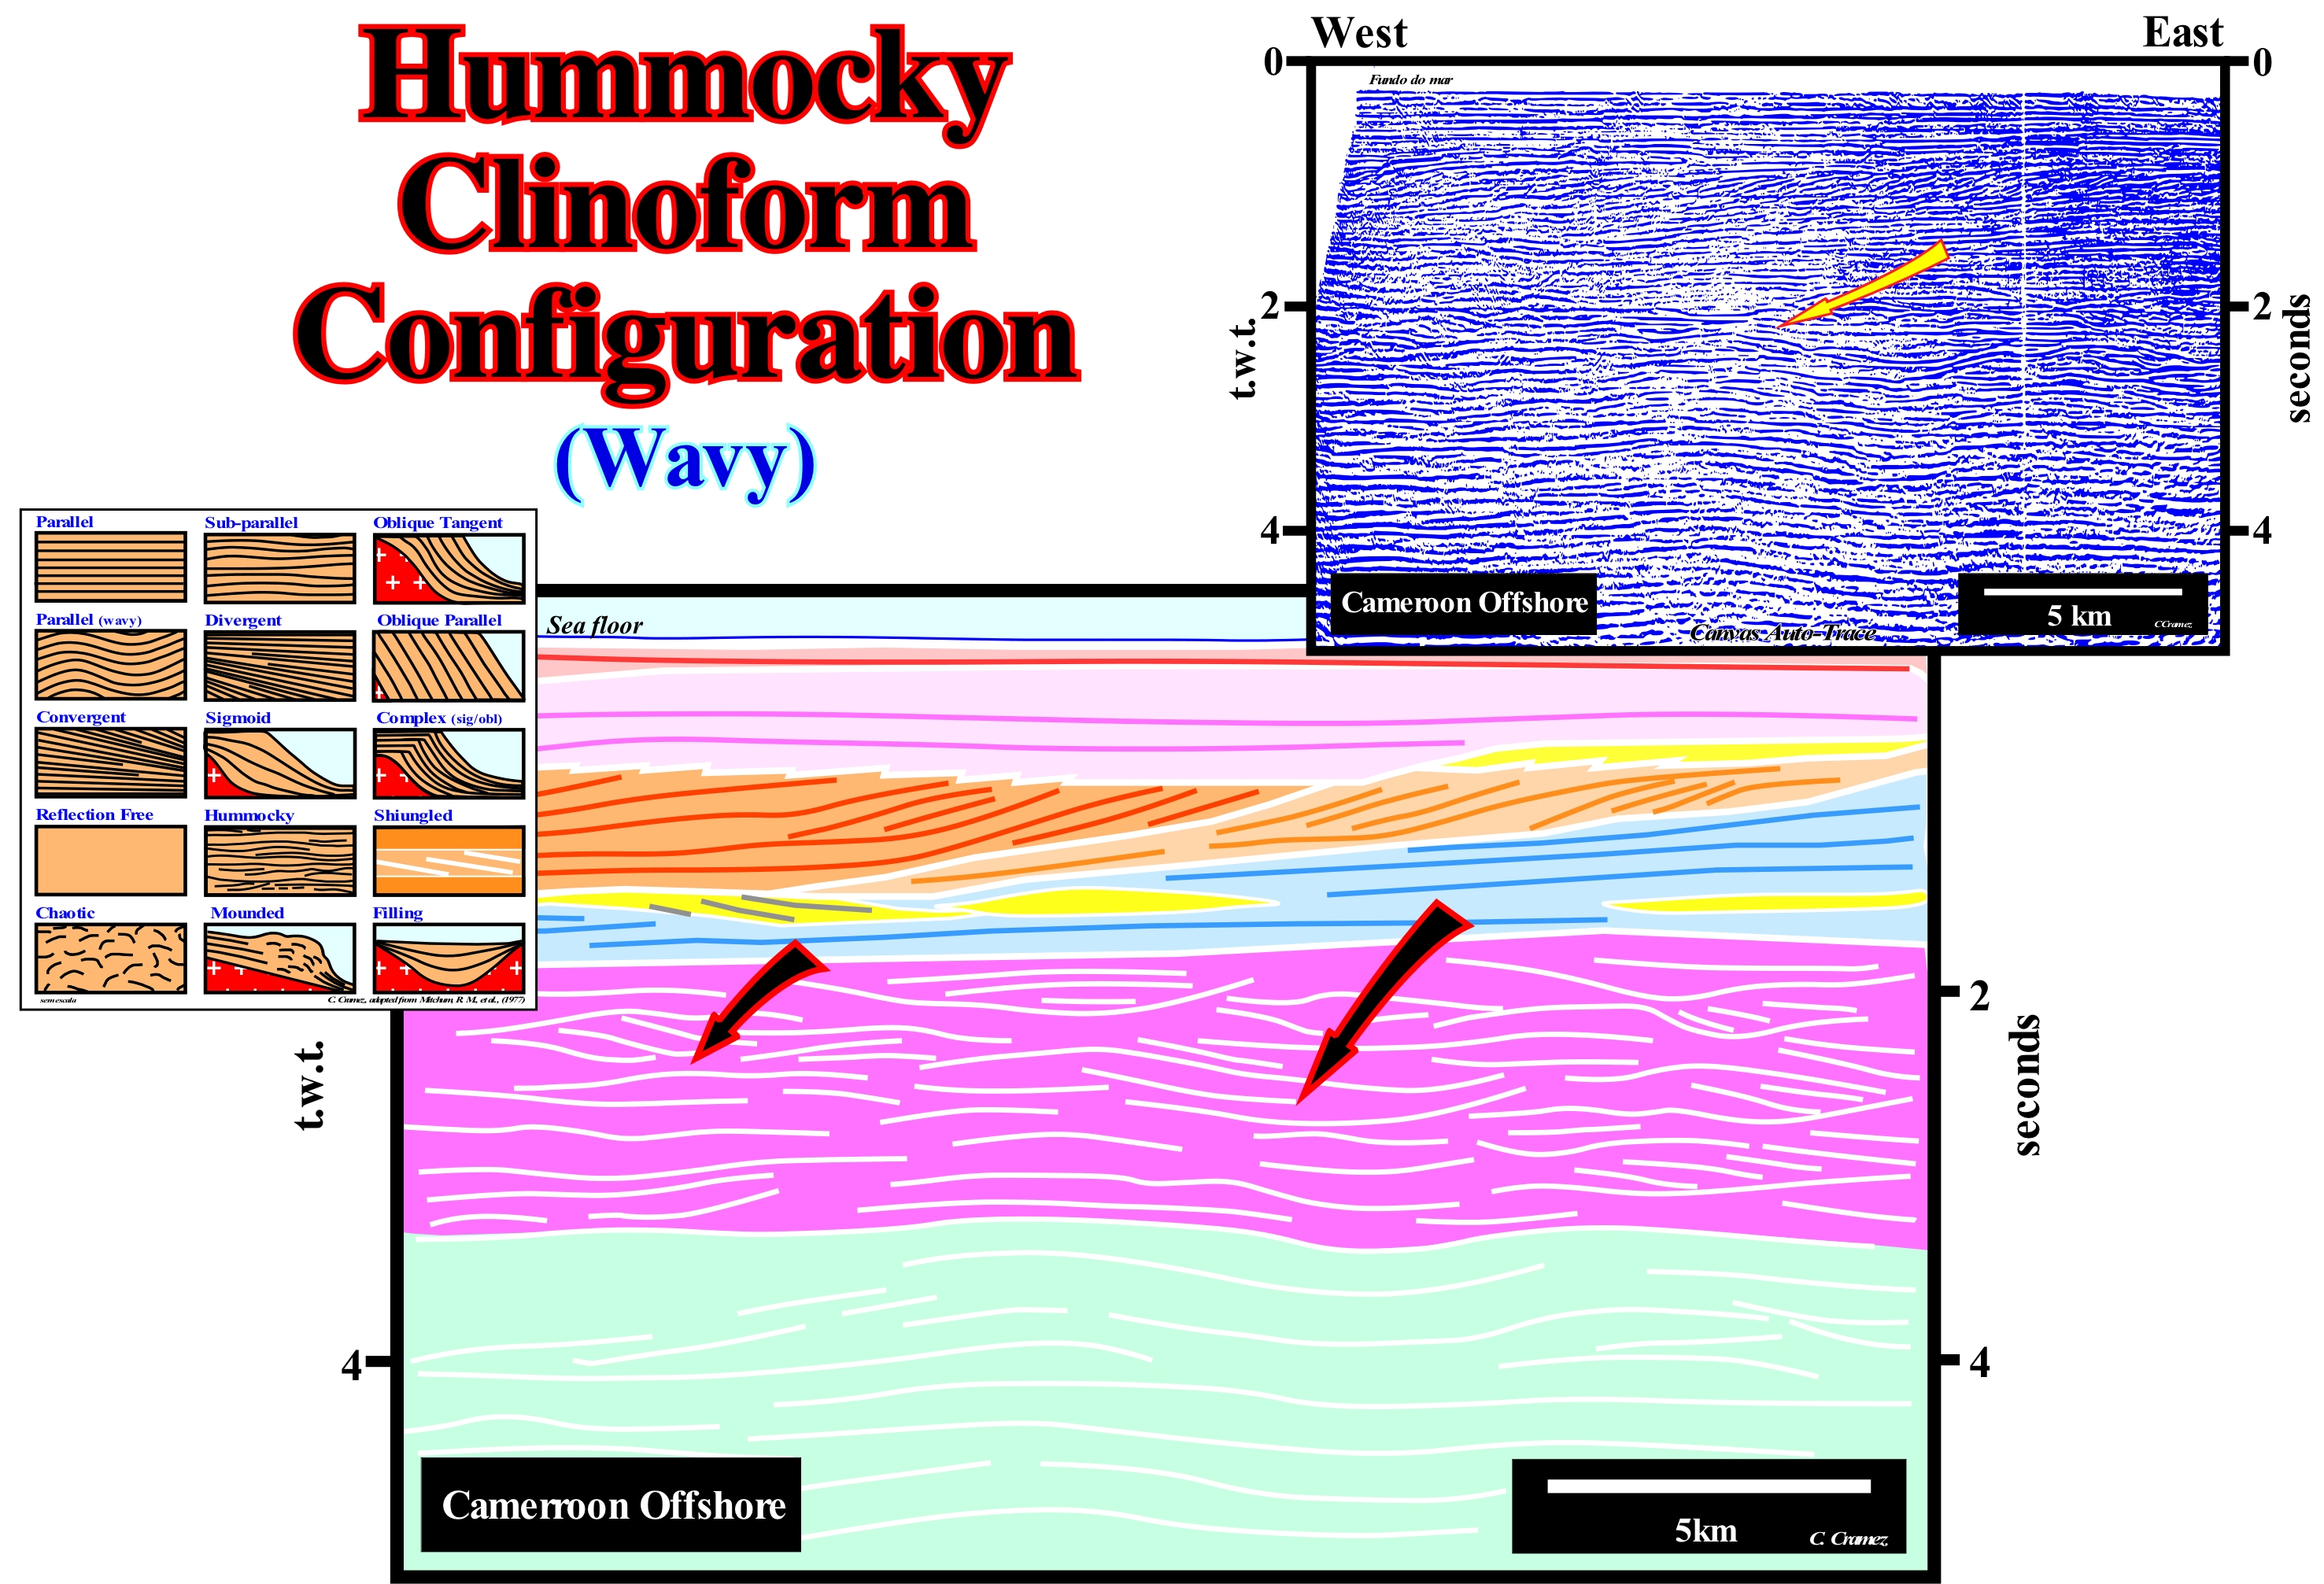
The Cameroon offshore, like the great majority of the offshore of West Africa, corresponds to the stacking of three types of sedimentary basins of different age from the classification of the sedimentary basins of Bally and Snelson (1980). From bottom to top such a basin are: (i) Paleozoic Folded Belt or Precambrian Basement ; (ii) Late Jurassic/Early Cretaceous rift-type type basins and (iii) Atlantic-Type Divergent Margin, which age ranges from the Early Cretaceous to the Present. The rift-type basins, which correspond to the lengthening of the small supercontinent Gondwana, before the break-up of the lithosphere that individualized the African lithospheric plate from the South American plate. These basins and, particularly, the more distal rift-basins (closer to the break-up zone) were, largely, fossilized by the lava that flowed from the expansion centres toward the Africa and South America cratons, as subaerial volcanic expansion proceeded. On this tentative geological interpretation of a Canvas auto-trace of a detail of a Cameroon conventional offshore seismic line (water-depth less than 200 meters), the thick sedimentary interval, between 1.8 and 3.1 seconds (upper part of the pink interval in pink), has an internally hummocky or, more or less, undulated configuration. The internal configuration of the underlying interval has a, more or less, parallel wavy configuration. The intervals that limit the pink package (blue and green intervals) have internal configurations, more or less, parallel which contrasts with the internal configuration of the pink interval, in which the seismic reflectors dip westward or eastward at first glance in a chaotic way. In the 1970s, the great majority of the oil company's geoscientists, working in this area, were looking for, mainly, anticline traps. In fact, the clinoforms with opposite vergences (dips) were interpreted as anticlines. However, the structures defined by these reflectors can not be explained by tectonics (extensional or compressional). The sediments are not, significantly, shortened or lengthened. There is just a sedimentological model that can explain such a geometric configuration in a satisfactory way (difficult to refute): a set of turbiditic natural marginal dikes or levees (overbanking deposits), i.e., channel levee complexes of Exxon's geoscientists. In the terminology of P. Vail, it can be said that the pink interval is mainly formed by gull-wings (in flight) structures, which correspond to a depositional system of submarine slope fans (SSF). During a significant fall of the relative sea level (combination of the tectonics and the absolute or eustatic sea level, which is the global and referenced to the Earth's centre or a satellite), the coastal onlaps are shifted seaward and downward (negative aggradation) and the former continental shelf (if it exists) is exhumed and exposed to erosional agents. The shoreline moves to the seaward. Similarly, the river mouths are displaced seaward and their provisional equilibrium profile is broken. As a consequence, turbidity currents are formed. They carry a large number of sedimentary particles to the deeper parts of the basin, where there is no accommodation problem (available space for sediments). forming submarine basin floor fans (SBFF). Since the rate of the relative sea level fall stabilizes or since the relative sea level begins to rise, the transport capacity of the turbidite currents decreases and since as they decelerate, they deposit the transport material in submarine fans and natural marginal dikes (levees), The marginal dykes are separated by a zone of non-deposition along which the thinner material is further conveyed downstream by the faster portion of the turbiditic current travelling between the levees. The following turbidity currents will use the depression between the already deposited natural marginal dikes, to travelling seaward. In other words, the next currents are, partly, channelled, while at the same time they deposit, by overbanking, other marginal dikes above the preceding ones, etc. It is this deposition geometry, which in a geological section or seismic line perpendicular to the regional direction of the terrigeneous influx creates a mounded clinoform configuration.
Hummocky Stratification (HCS).........................................................Stratification Entrecroisée Bosselée
Estratificação mamelonada / Montículos de estratificación cruzada / Hügelige Cross-Schichtung / 丘状交错层理 / Холмистая косая слоистость / Hummocky cross-stratificazion /
Stratification cross-ondulated HCS ("Hummocky Cross Stratification") characteristic of the sandstone laminae deposited on the continental shelves iunder the action of the storm waves.
See: « Hummocky Clinoform Configuration »
&
« Stratification (sediments) »
&
« Beach Ripple Mark »
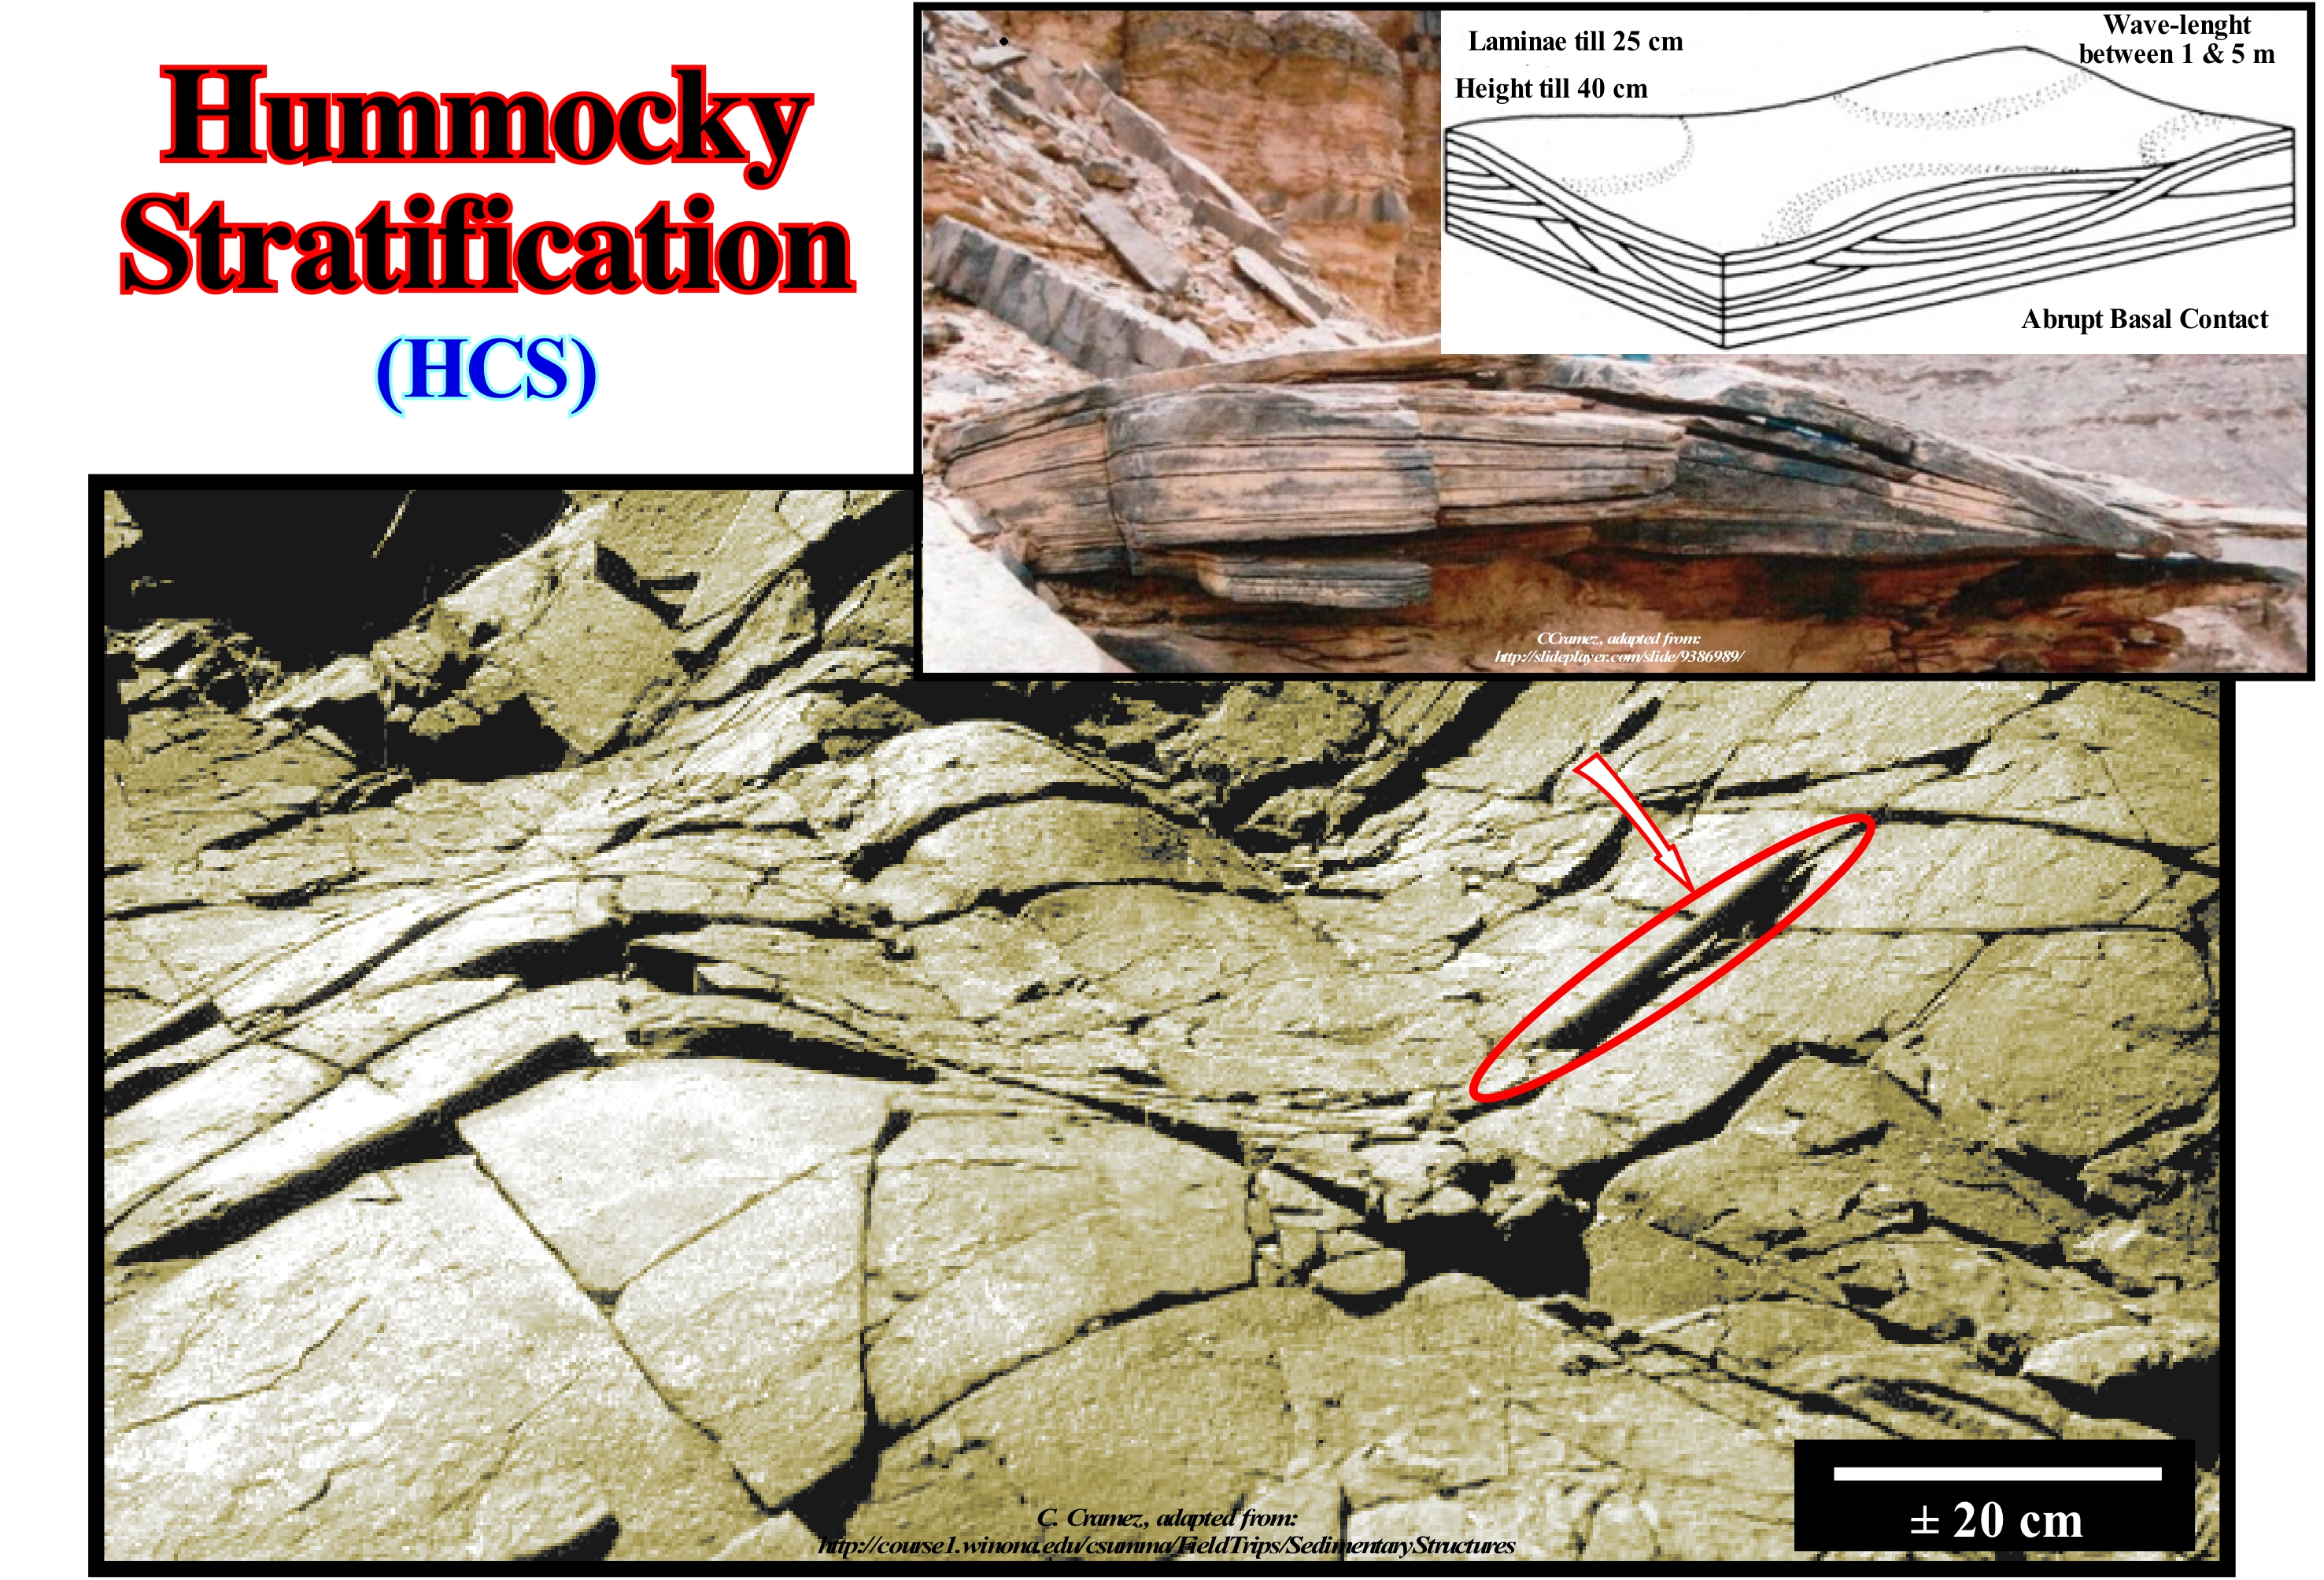
The hummocky stratification or mounded truncated stratification (HCS, i.e., "Hummocky Cross Stratification *") is formed to the passage of the symmetrical aggradational ripples. As these waves are symmetrical and the flows correspond mainly to simple backward and forward movements and not to downstream flows, the stratification is characterized by sedimentary laminae, which fill the crests and troughs: the laminae have a convex and concave upward geometry. When the laminae are amalgamated, this type of lamination may be confused with a concave oblique stratification or TCS (Trough Cross Stratification), because the convex upward laminae are, often, truncated. The pelagic layering forms on the shoreface and continental shelf by the sea-waves. It characterizes a wave-dominated environment. The tabular cross stratification is induced by the migration of asymmetrical undulations or linear undulations. A concave or arched oblique (TCS) layering is induced by the migration of asymmetrical ripples or tongue-shaped dunes having a sinuous crest and a strong three-dimensional shape. The variations of truncated rippled or hummocky cross stratification ("HCS") give very important information about the history of sedimentation and paleogeography. The diagnostic elements are not only the antiform and sinform geometry, but also the slope of the laminations (<15°) and the angle of truncation (<15°). The mounded stratification is formed mainly in the silts and fine sands. Although the size of the laminations is not characteristic, the concentrations of mica and plant remains at the top of the laminae indicate a certain form of sorting. Layers with laminated layers have very variable thicknesses, ranging from a few centimeters to 5-6 meters. However, sets of layers can reach tens of meters. This type of stratification is apparently formed, in calm sea conditions, mainly by a re-deposition by the great waves of fine sand from the flood of rivers, the erosion of the low beach and the sand shoal. The deposition is done either by decanting or by lateral traction induced by the oscillation of the waves. Under an intense oscillatory flow, the great sea waves put sand on the eroded and irregular surfaces, but also deposit sand in more or less, circular mold.
(*) A type of cross-laminate formed by a combination of a unidirectional flow with another oscillatory flow. Its origin has been associated with the action of storm waves, although certain geoscientists admit that it can also be produced by gravitational flows associated with heavy flooding.
(**) Stratification produced by the migration of the downward flow of moon-shaped dunes in submarine or subaerial environments.
Humus...........................................................................................................................................................................................................................................................Humus
Humo / Humus / Humus / 腐殖质 / Гумус, перегной / Humus /
Organic matter of a soil that has reached the point of stability, from which it can not be further decomposed and remains, if environmental conditions do not change, in this state for centuries if not millennia.
See: « Soil »
&
« Humification »
&
« Organic Matter (types) »
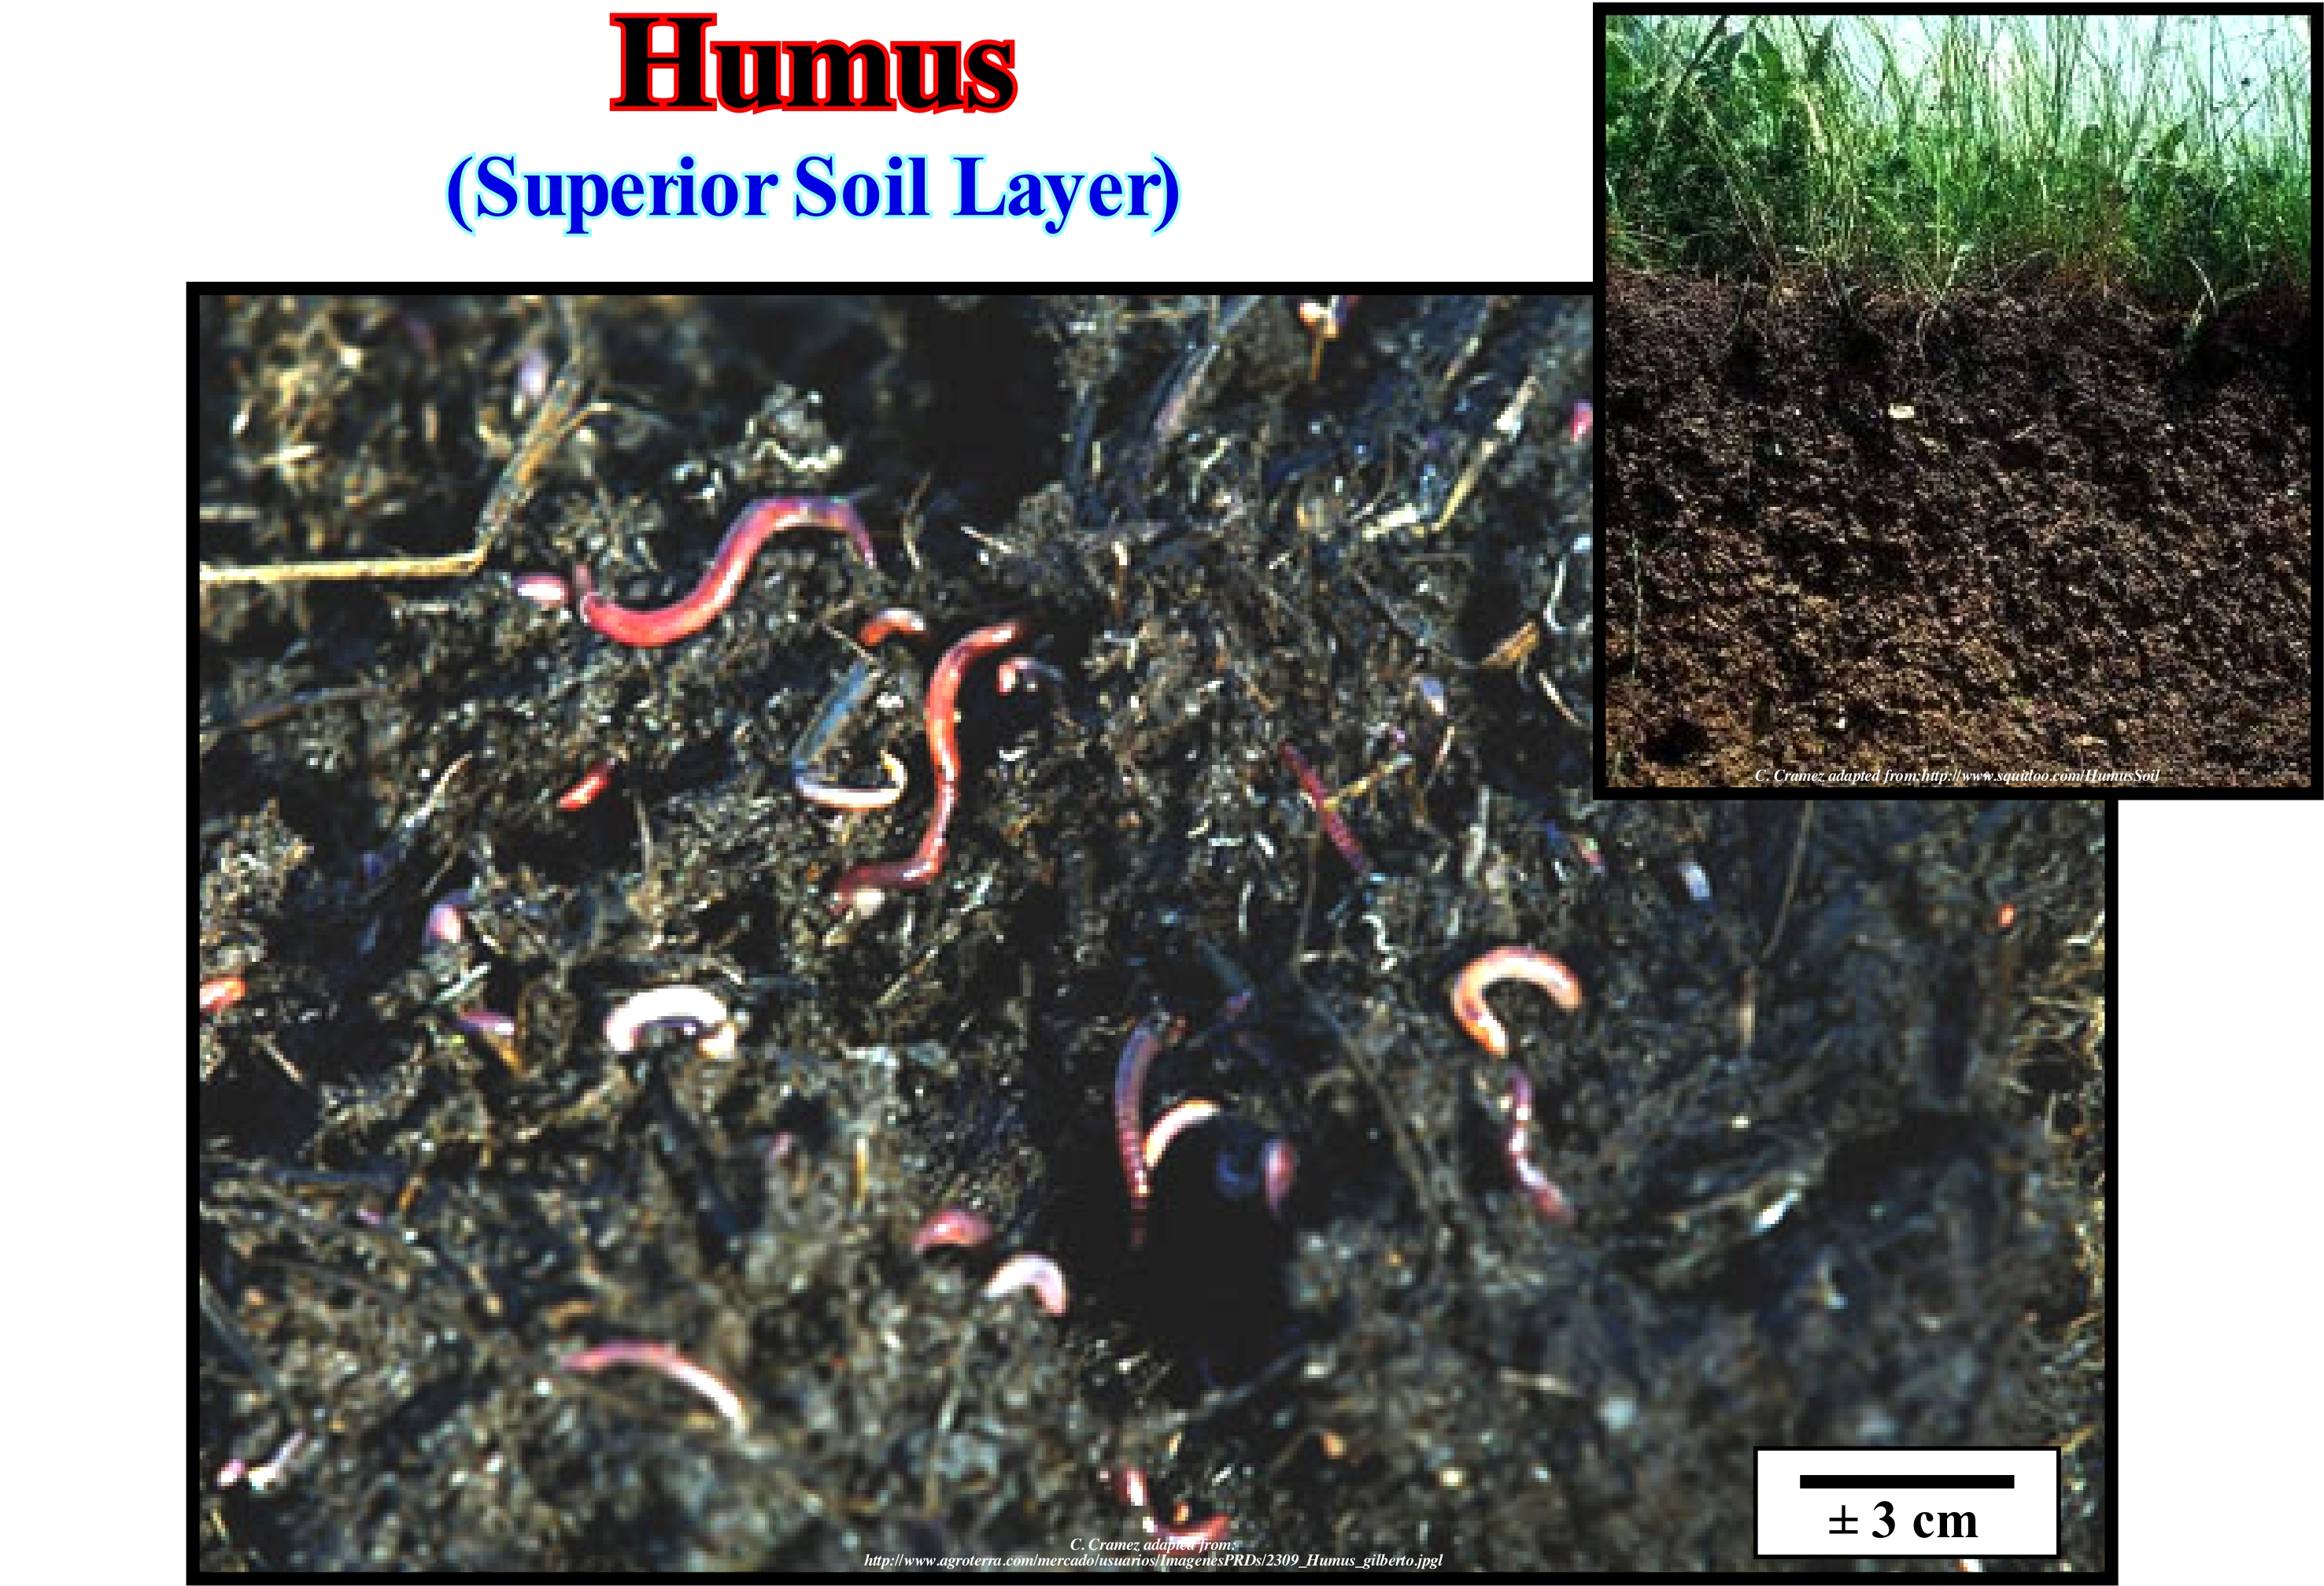
Humus is the organic matter deposited in the soil, resulting from the decomposition of dead animals and plants, or their by-products. The process of humus formation is called humification. It can be natural, when spontaneously produced by bacteria and soil fungi (decomposing organisms), or artificial, when man induces the production of humus, adding chemicals and water to a soil productive. Various external agents such as humidity and temperature contribute to humification. In the formation of the humus there is release of several nutrients, but the release of nitrogen is, especially, important. Composting is a way to manufacture humus to use as a compost, which is and organic fertilizer in agriculture. The vermicompost is the use of earthworm in the production of humus, decomposing waste and animal waste and also urban waste (organic), collaborating with the improvement of soils, sequestering carbon and eliminating unpleasant odours. Vermicomposting is a very widespread process, especially, among rural dwellers, since the worm is a true waste cleaning machine. When you put the correct amount of earthworms (around 5,000 units per square meter) in 30 to 35 days (in normal composting it takes 100 to 300 days), you can turn 2.5 tons of organic waste into humus into a 10 x 0.80 x 0.40m. The earthworm eats the waste. As their excrement has around 2 million bacteria per gram, they enrich the soil leaving, virtually, the entire mineral complex available (five and a half times more nitrogen, twice as much calcium, twice as half more magnesium, seven times more phosphorus and eleven times more potassium than the soil or the residue that was fed). The formation of humus is biogenic. The humus can be formed by simple oxidation of dead organic matter, in the absence of living organisms, but this process is, greatly, accelerated when organisms ingest organic material or secrete enzymes that transform it.
Huygens' Principle..........................................................................................................................................................Principe de Huygens
Princípio de Huygens / Principio de Huygens / Huygens Prinzip / 惠更斯原理 / Принцип Гюйгенса / Principio di Huygens /
Any point on a wavefront is the source of secondary waves.
See: « Wave »
&
« Crest (wave) »
&
« Swell (sea) »
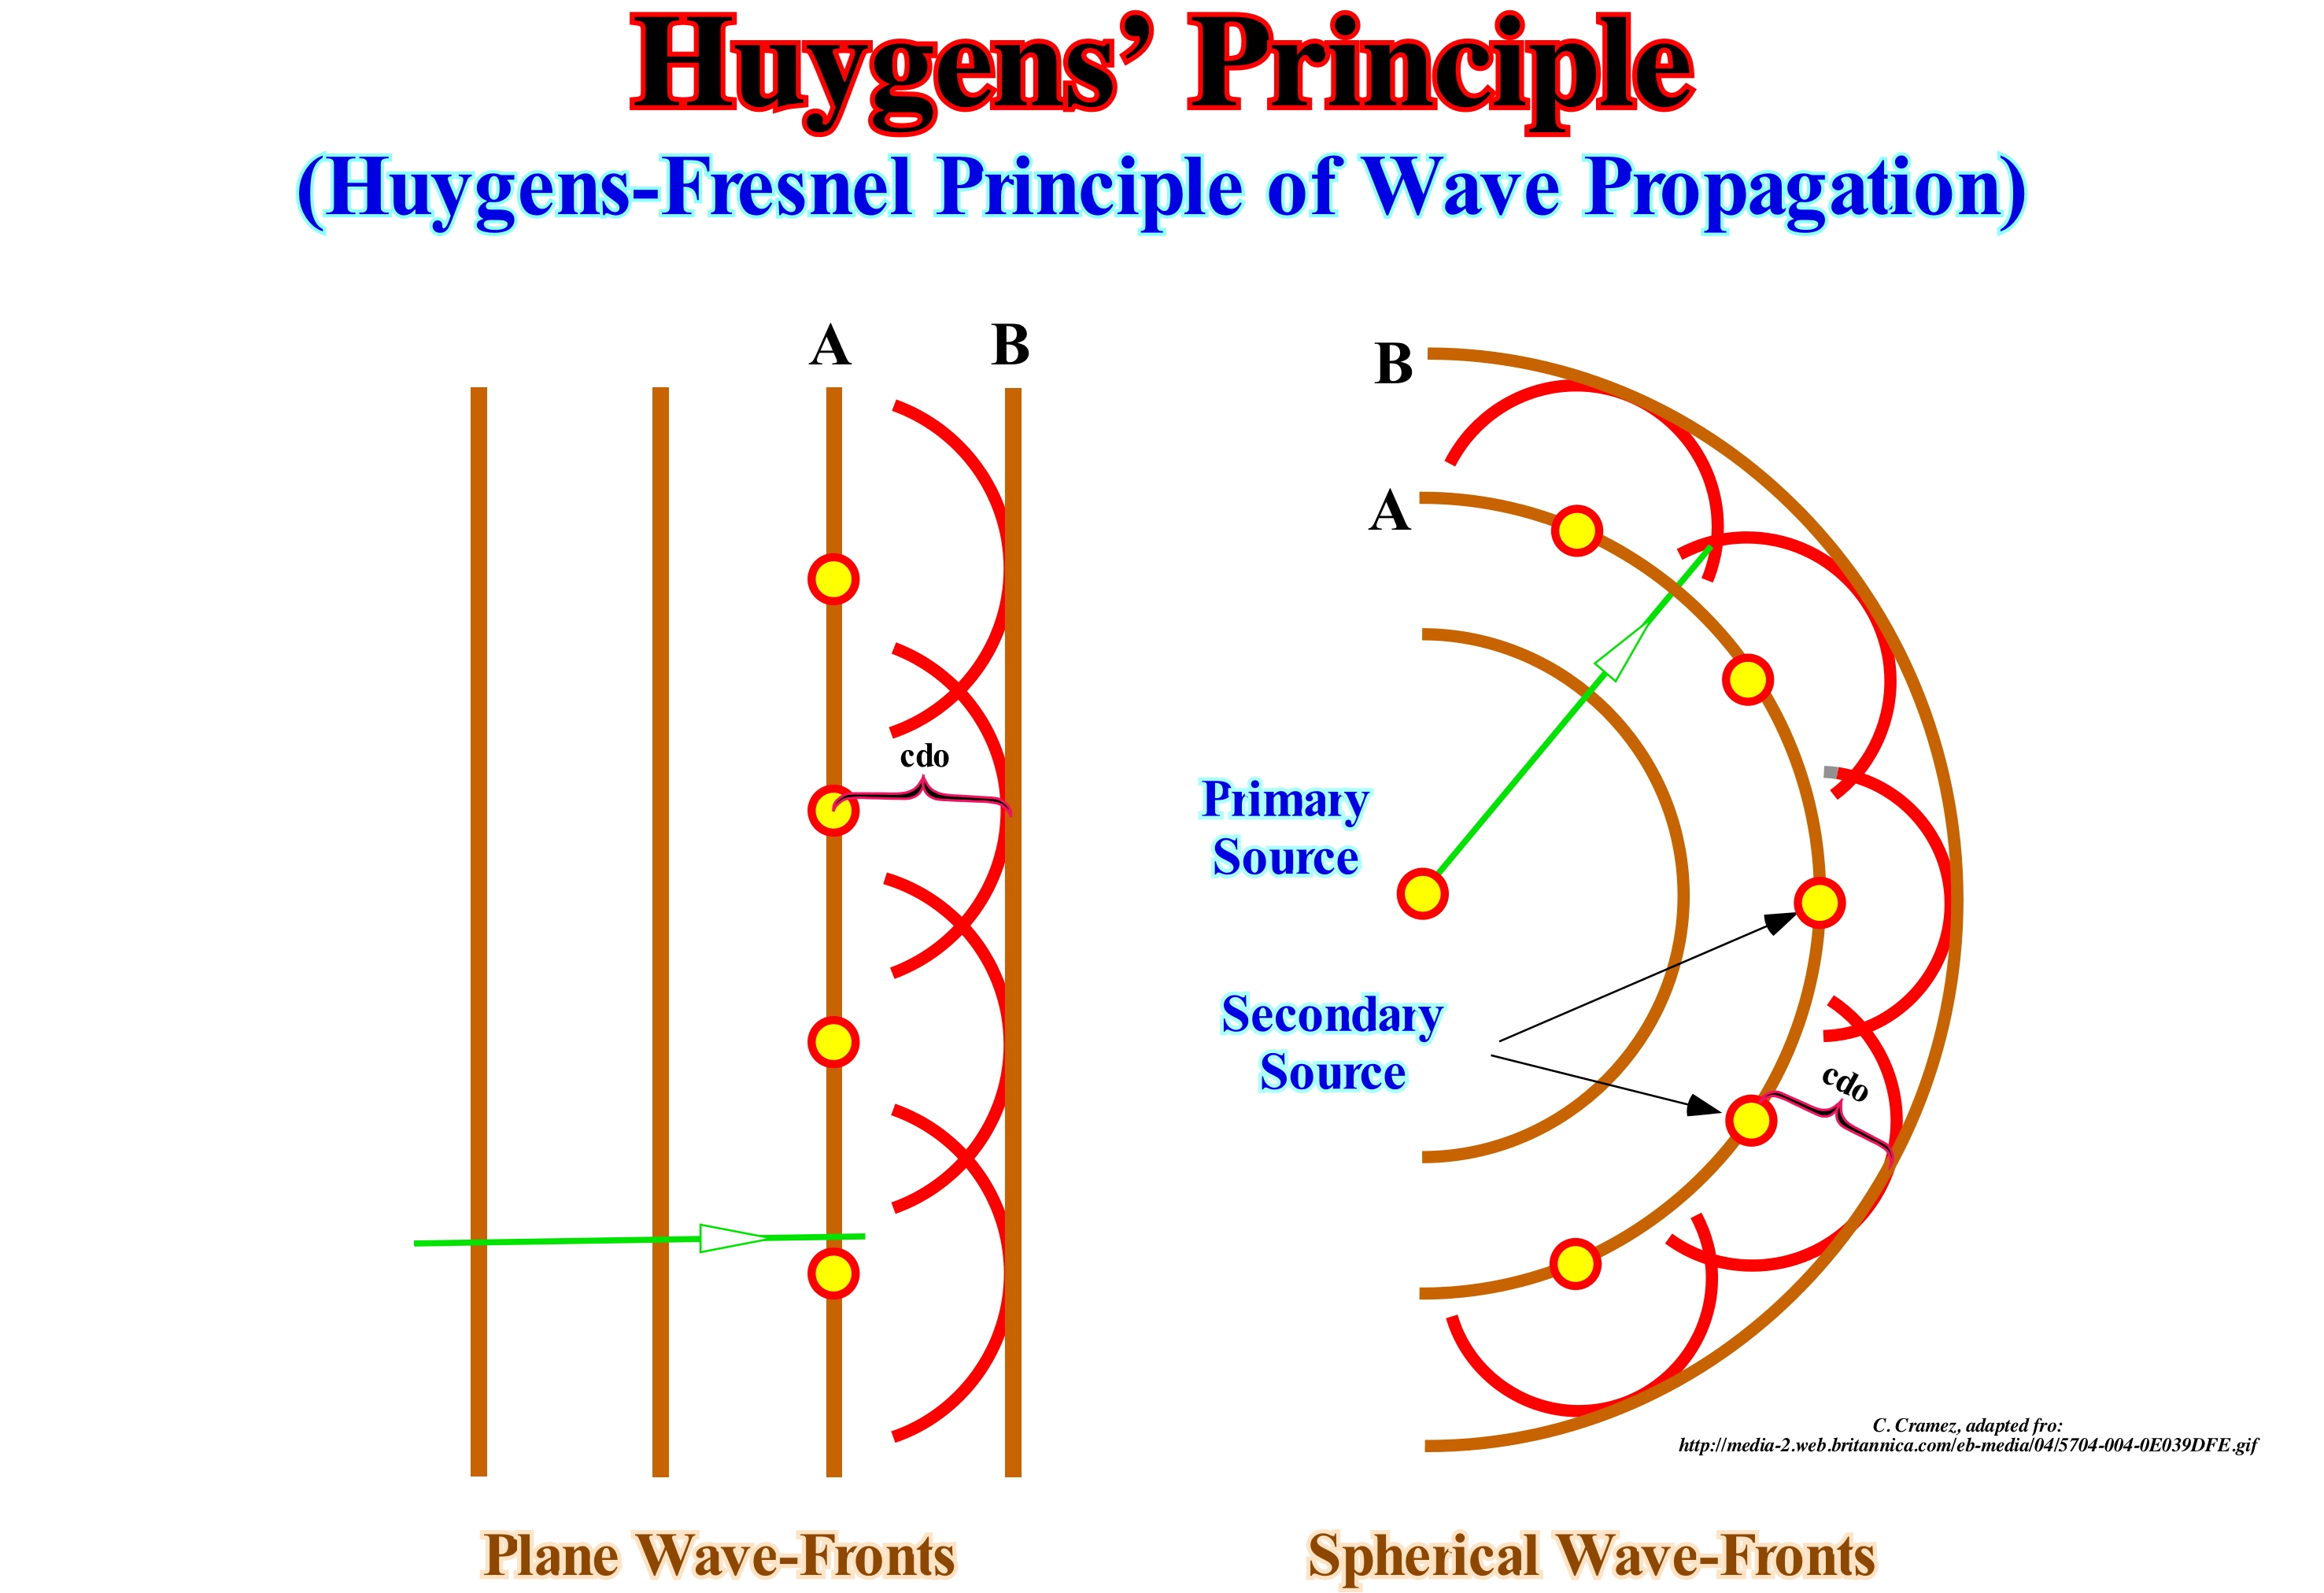
This principle, formulated by Fresnel in 1815, resumes the basis of the wave model developed by Huygens in 1690. The Huygens' principle states that each point located on the wave front behaves as a new point source for the emission of new spherical waves, will form a new wave-front and so on. To better understand this principle, consider a plane wave, whose wave-front is rectilinear. Then consider the points on a plane P parallel to the wave-front (for simplicity, consider only the wave period, whose maximum value passes through P at time 0). For a "complete" wave (infinite sinusoid), you simply overlap the periods. If each point of P emits a spherical wave, after a time t: (i) A point located at a distance cdo from the plane P will receive only the front of a single spherical wave (emitted by the point of P closest to the time 0 ), each point on this parallel plane will have a positive amplitude ; (ii) A point beyond this distance has not yet received the wave and therefore has a zero amplitude ; (iii) A point before this distance receives waves from many points of P (the "sides" of spherical waves), but the waves have a different offset, whose amplitudes cancel out. This means that considering the spherical re-emission, a plane-front is obtained, which progresses at a constant speed c, with the plane front progressing at a speed c. In the case of the propagation of light in a solid, the wave advances step by step. In fact, the electron cloud of atoms mask the wave in such a way that it can not progress, but can excite itself the atoms that reissued wave (Rayleigh diffusion), which will excite the neighbouring atom. This explains, in particular, the deceleration of the wave (and the refractive index n): electromagnetic waves no longer advance at the speed of light in the vacuum (c = 300,000 km/s), but at speed c/n, i.e., each wave-front is retarded by the phenomenon of masking and reissue. But the Huygens' principle is, also, valid for propagation in a vacuum without material support. In the case of flat sources, the Huygens' principle can be overcome by introducing the concept of plane wave spectrum, offering the exact solution at any distance.
Hydraulic Current..................................................................................................Courant de compensation hydraulique
Corrente de compensação hidráulica (corrente de descarga) / Corriente de compensación hidráulica / Auslad Strömung, Löschung Strömung / 液压电流 / Гидравлическое течение / Corrente di compensazione idraulica /
Flow along a channel due to a water level difference at both ends. A hydraulic compensation current functions as an electric current (the electrical voltage, i.e., the potential difference corresponds to the height difference of the water level).
See: « Stream »
&
" Capsizing Current "
&
" Turbiditic Current "
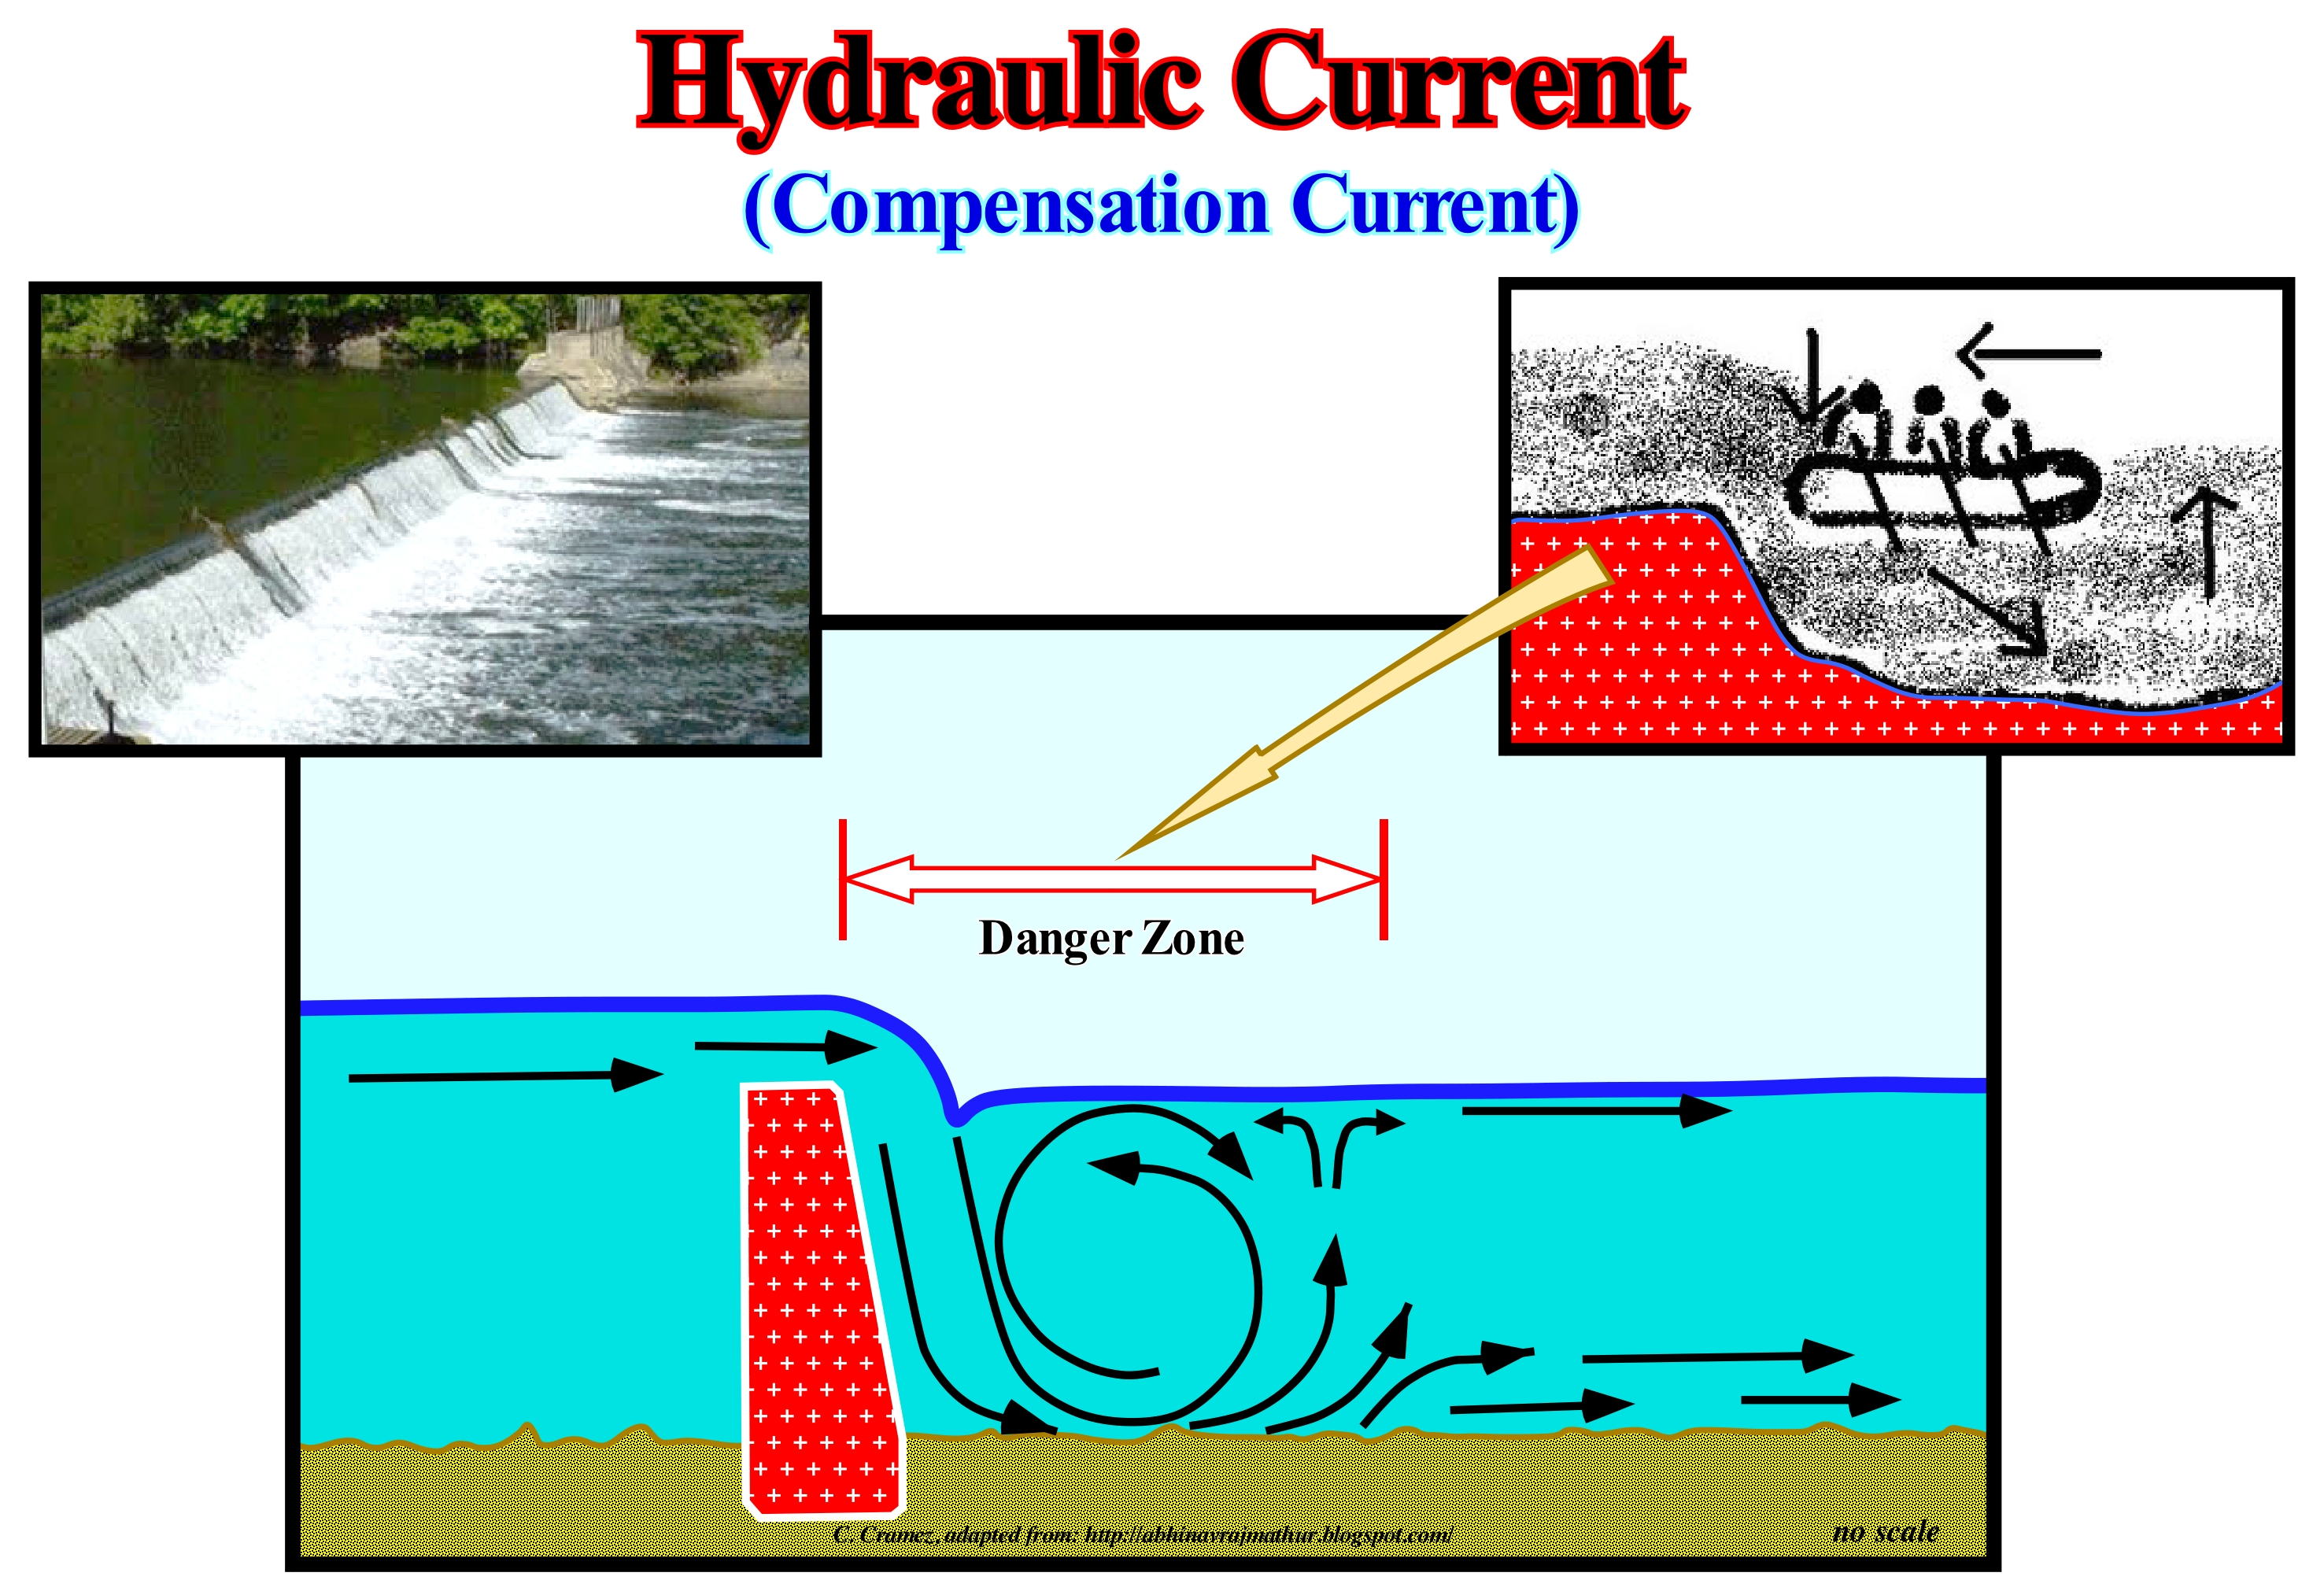
As shown in this figure, when a water stream flows over an obstacle and falls, the flow velocity accelerates and creates a partial flow toward the obstacle or the fall. Small hydraulic current are not dangerous and can be used for children to have fun either sitting on them or riding them. However, large, strong hydraulic currents are extremely dangerous. Numerous deadly accidents occur in these currents that spinning around and around the victims pull them in deep, eventually, drowning them. If you happen to fall into a strong hydraulic current, do not fight against it, dive to the bottom of the current and swim a dozen or two meters downstream to get out of the current. Then, rise to the surface. Never forget since there is a level difference (artificial or natural) in a water-course, the formation of a hydraulic current in the lower part adjacent to the rupture is inevitable. There is an almost perfect analogy between an electric current and a hydraulic current. If we consider the electrical voltage (potential difference), as the abrupt difference in altitude along a water-course, the electric current flows towards the weaker potential, just as the water-course flows towards the lower altitude zone. Hydraulic currents are very common along the coastline. The relative size and shape of the water- bodies on each side of an inlet (passage between two barrier bars) influence the tides and currents in the surrounding areas. Often the pattern of tidal currents between the ocean and, say, an estuary, are not in phase. The tide may be upstream on one side of the inlet and downward (ebb) on the other side, which naturally produces a, more or less, important hydraulic current, which means that high and low-tide can occur at the same time in different places. This may seem like an impossible situation, but in reality, it is quite common.
Hydrocarbon...........................................................................................................................................................................................................Hydrocarbure
Hidrocarboneto / Hidrocarburo / Kohlenwasserstoff / 烃 / Углеводород / Idrocarburo /
An organic compound formed entirely from hydrogen and carbon. Most hydrocarbons are found in petroleum. Hydrocarbons are one of the most important energy sources on Earth. Hydrocarbons are mainly used as fuels. Mixtures of volatile hydrocarbons are currently used to replace chlorofluorocarbons as propellant for aerosol sprayers since they have no (negative) impact on the ozone layer *.
See: « Methane »
&
« Petroleum »
&
« Asphalt »
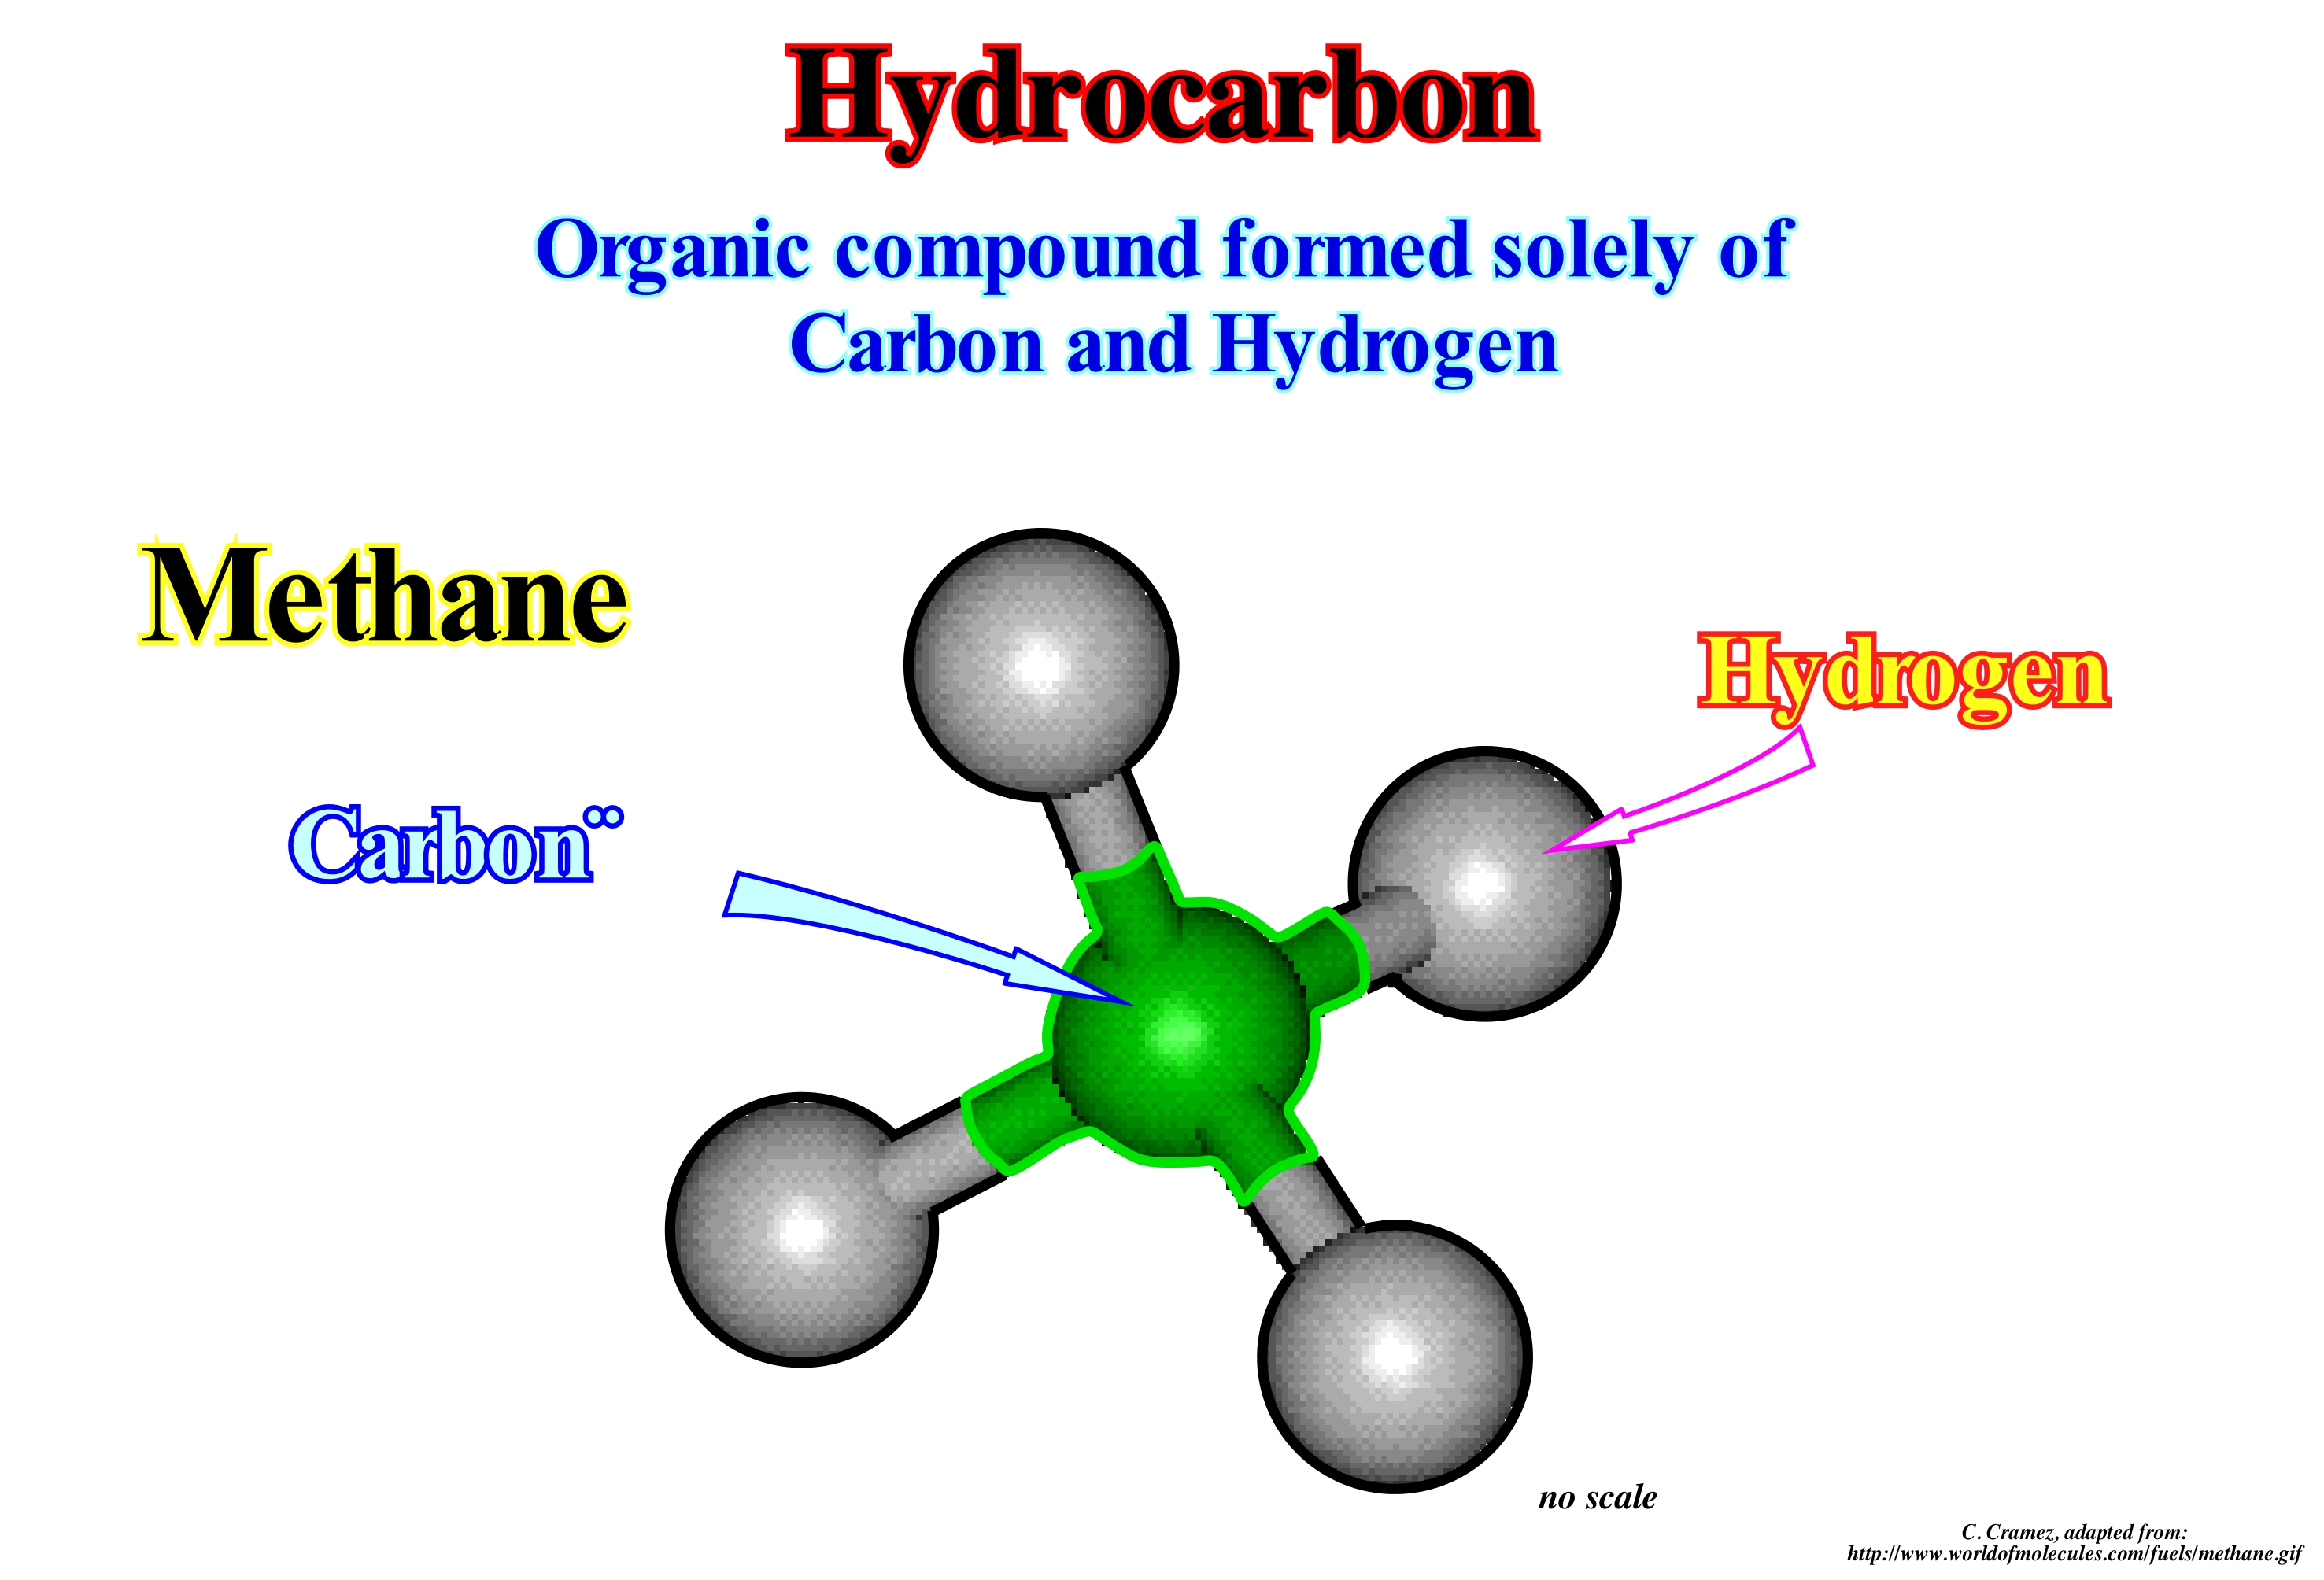
Although the hydrocarbons produced by exploration wells are, generally, referred to as oil or gas, there are a number of other hydrocarbons among them. The first five members of the paraffin family (named for hydrocarbons whose formula is CnH2n+2) contains 1 to 5 carbon atoms. The molecule with a carbon atom, which is illustrated in this figure, is methane, which is the main component of natural gas. The others are called, respectively, ethane, propane, butane and pentane. Propane and butane are the hydrocarbons that are sold in gas bottles. Hydrocarbons with 3/5 carbon atoms are known as: condensed gas, natural gas liquids, white gold (contrast to "black gold", i.e., oil). The hydrocarbons may form straight or branched chains. Some of these are, naturally, produced by plants and animals. The wax that is produced in our ears is a typical example of the production of hydrocarbons by man. The simplest rectilinear chains are most likely to hiss (uncontrolled detonation) in a car engine. They are the basis of gasoline octane rate measured from gasoline resistance to detonation. A molecule with seven straight carbons (heptane) has zero octane, while a branched seven-carbon molecule has 100. The octane number of gasoline, which we use or used in automobiles (aliphatic hydrocarbons, i.e., without aromatics, reinforced with iso-octane or benzene), is determined by comparison to a mixture of these two types of two molecules (heptane). The typical property of hydrocarbons is that they produce hydrogen, carbon dioxide and heat during combustion and that oxygen is required for combustion to occur. Thus, the methane is burned as follows: CH4 + 2 O2 → 2 H2O + COn2+ Energy.
(*) Interval, about 10 km thick, of the terrestrial stratosphere with a strong ozone content (formed by the combination of three oxygen atoms), between 15 and 35 km altitude, which contains about 90% of the atmospheric ozone. In this layer the gases are so rarefied that if compressed at atmospheric pressure at sea level their thickness would only be a few millimeters.
Hydrofracturing...........................................................................................................................................................................Hydrofracturation
Hidrofracturação / Hidrofracturación / Hydraulic Fracturing / 水力压裂 / Гидроразры́в пласта́ / Fratturazione idraulica /
Injection a liquid under high pressure to open the fractures around a production well whether it produces water or hydrocarbons.
See: « Hydrocarbon »
&
« Dipmeter Log »
&
« Limestone »
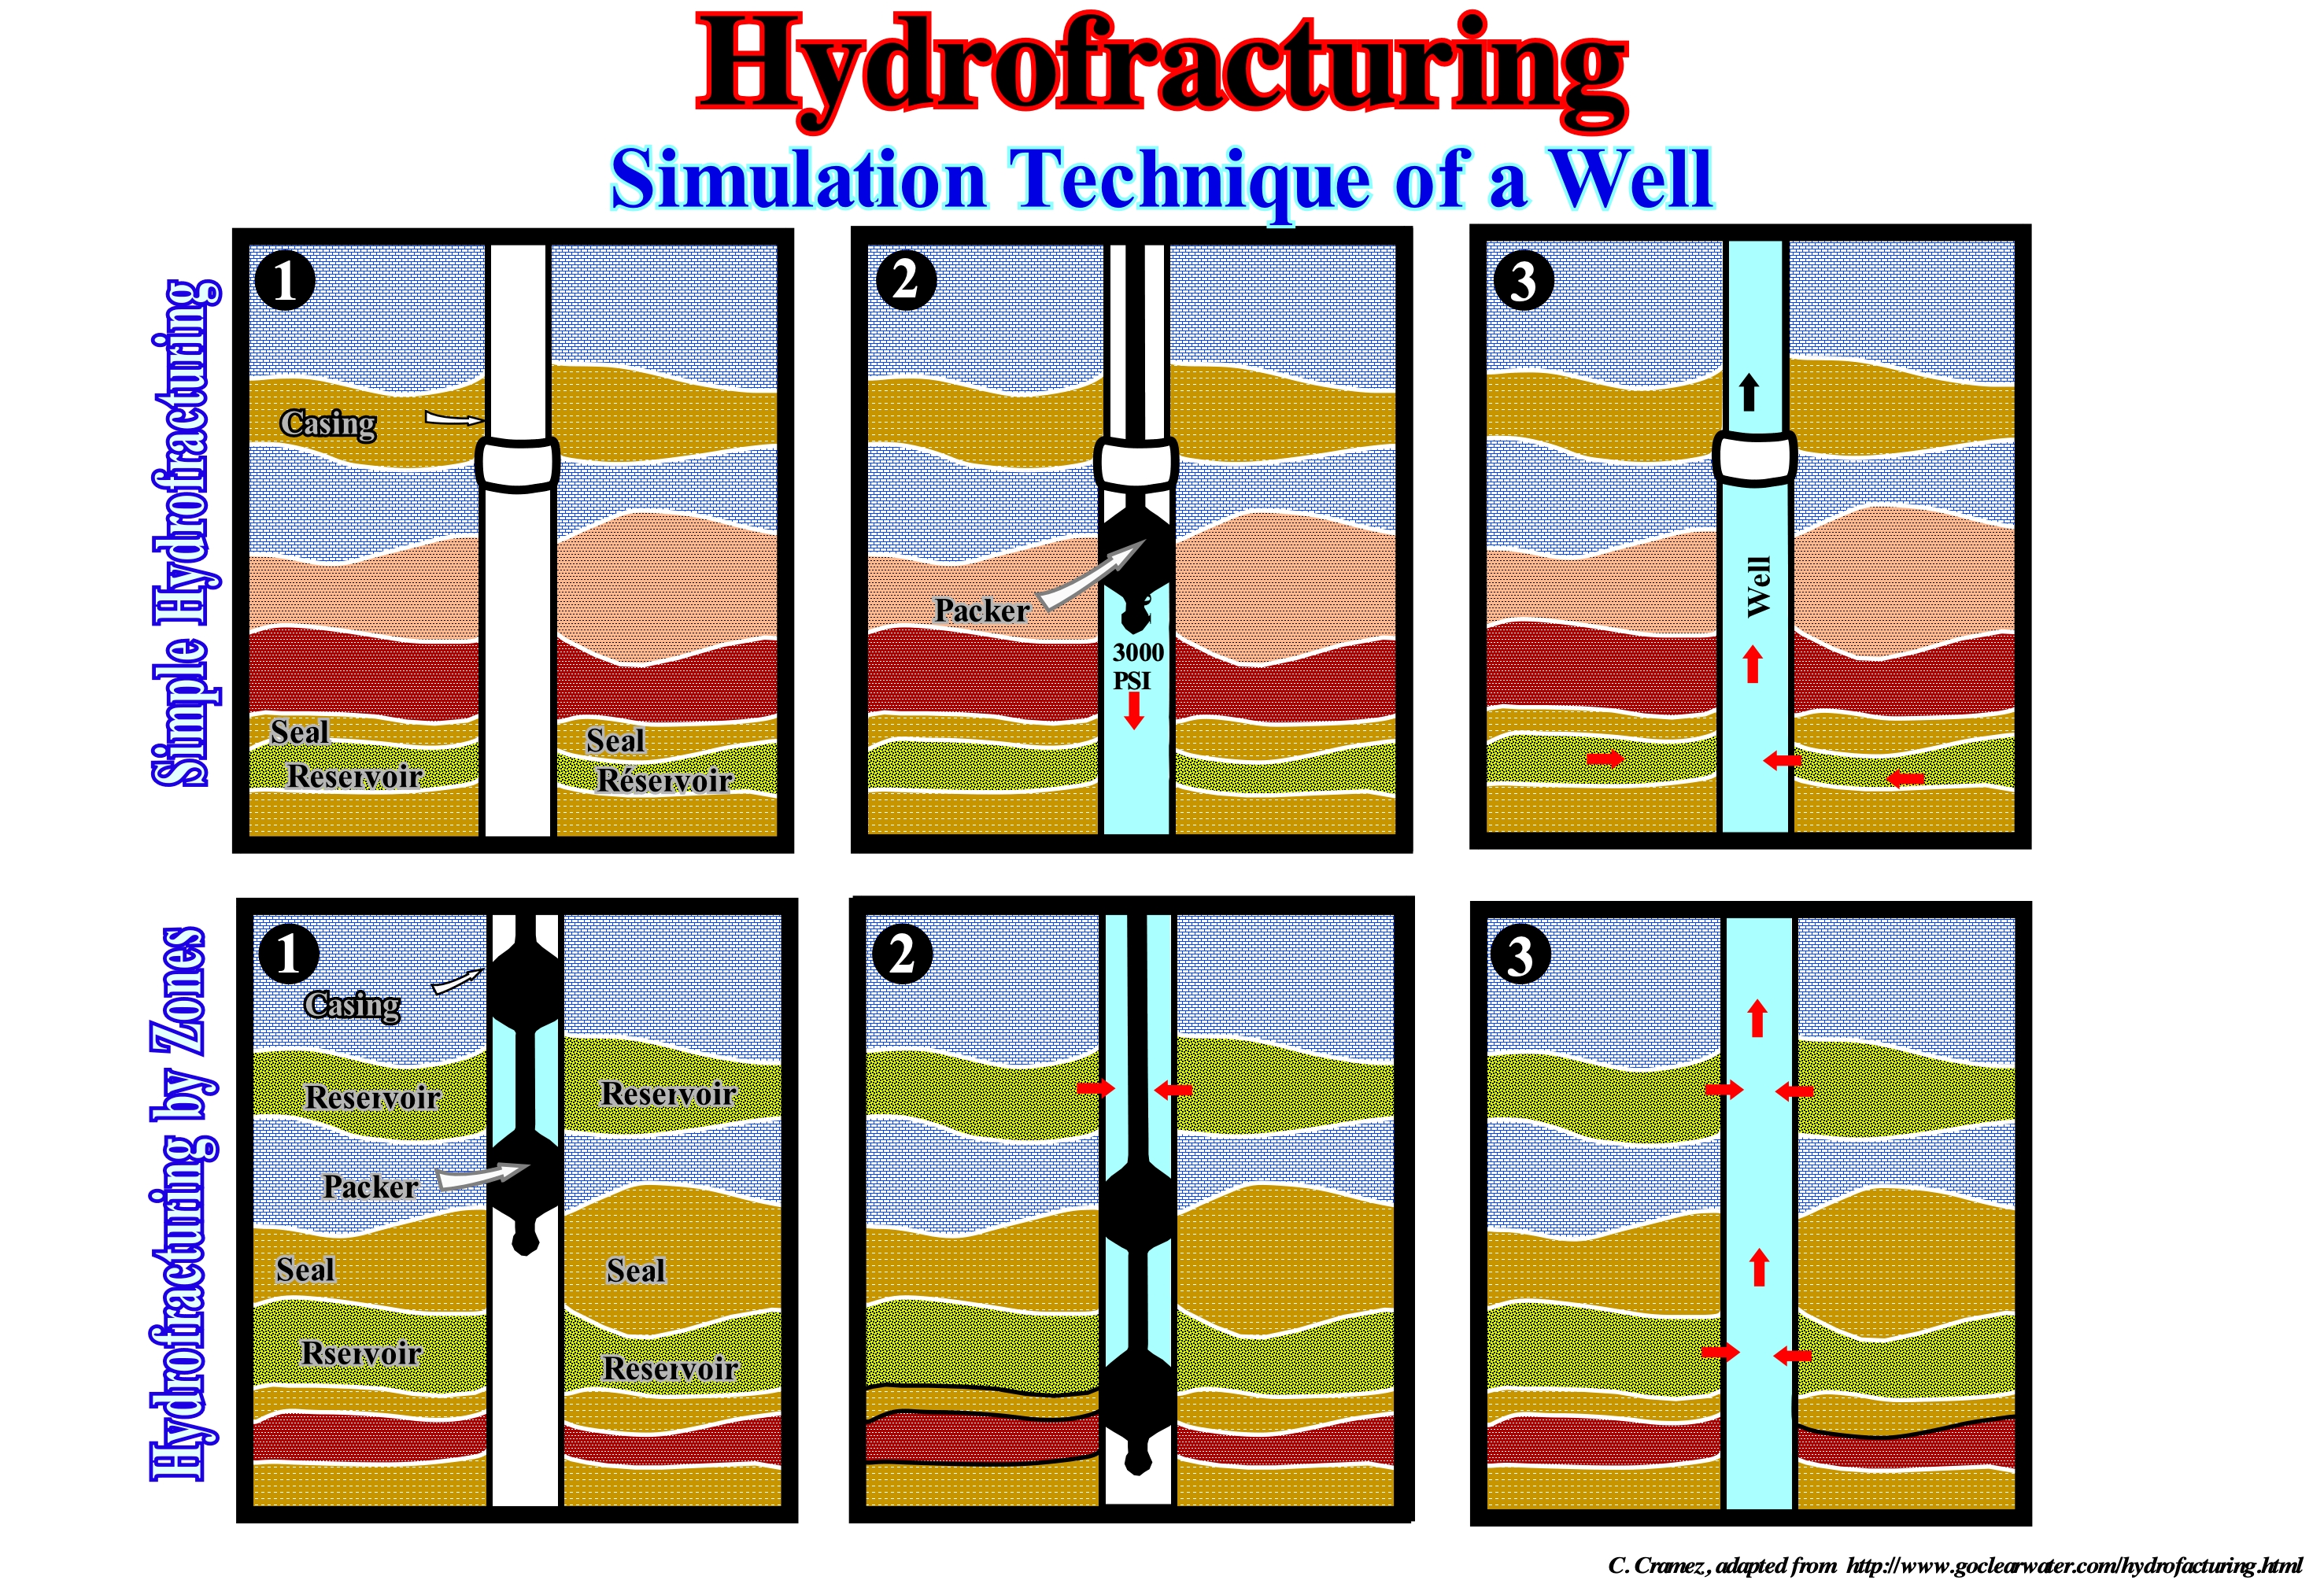
Hydro-fracturing is a method of developing and rehabilitating a production well, usually an oil well, by water. Hydrofracturing is used to increase the yield of the low production wells (either water or oil) in geological formations where fracture systems are poorly developed or very closed. In the United States, hydro-fracturing has been used since the 1980s to increase the production of water production wells. Initially, the hydro-fracturing was used in shallow wells (75-180 meters) drilled in the basement (granite, gabbros, etc.) and in sedimentary rocks, like limestones and sandstones. Most of the time, fracturing was done between 1,000 and 2,500 psi for the rock of the basement and between 300 and 800 psi in the sedimentary rocks, which produced a surface water flow between 250 and 450 litres per minute. Practically, in the first phase of a hydro-fracturing, a packer is lowered and expanded in order to isolate the zone of the rock-reservoir that must be rehabilitated. The water is then pumped at high pressure through an injection tube into the rock-reservoir zone. The pressure and the forced flow towards the rock-reservoir create, in the production zone, the opening of small radial fractures. The fractures thus opened or of neoformation create connections with the old fractures, which contain water, and with the walls of the well. In a well in an oil field, the principle is, more or less, the same: (i) Hydrofracturing equipment injects water under high pressure into the reservoir-rock ; (ii) The water pressure opens the rock-reservoir fractures, which allow the saturant (oil or gas) to flow into the well. In an hydrofractured zone, each potential production zone is individually isolated with the drilling packers and high pressure water is injected to increase the permeability of the formation. This operation is carried out for all potential reservoir-rock zones, which allows a flow of the saturant to the well, which is then recovered on the surface either naturally or by pumping.
Hydrography........................................................................................................................................................................................................Hydrographie
Hidrografia / Hidrografía / Hydrographie, Bewässerungkunde / 水文 / Гидрография / Idrografia /
Science concerned with the measurement and description of waters and, in particular, measurements and descriptions of navigable waters required for safe navigation of ships. Oceanography and limnology are branches of hydrography.
See: « Drainage Basin »
&
« Channel »
&
« Sea floor »
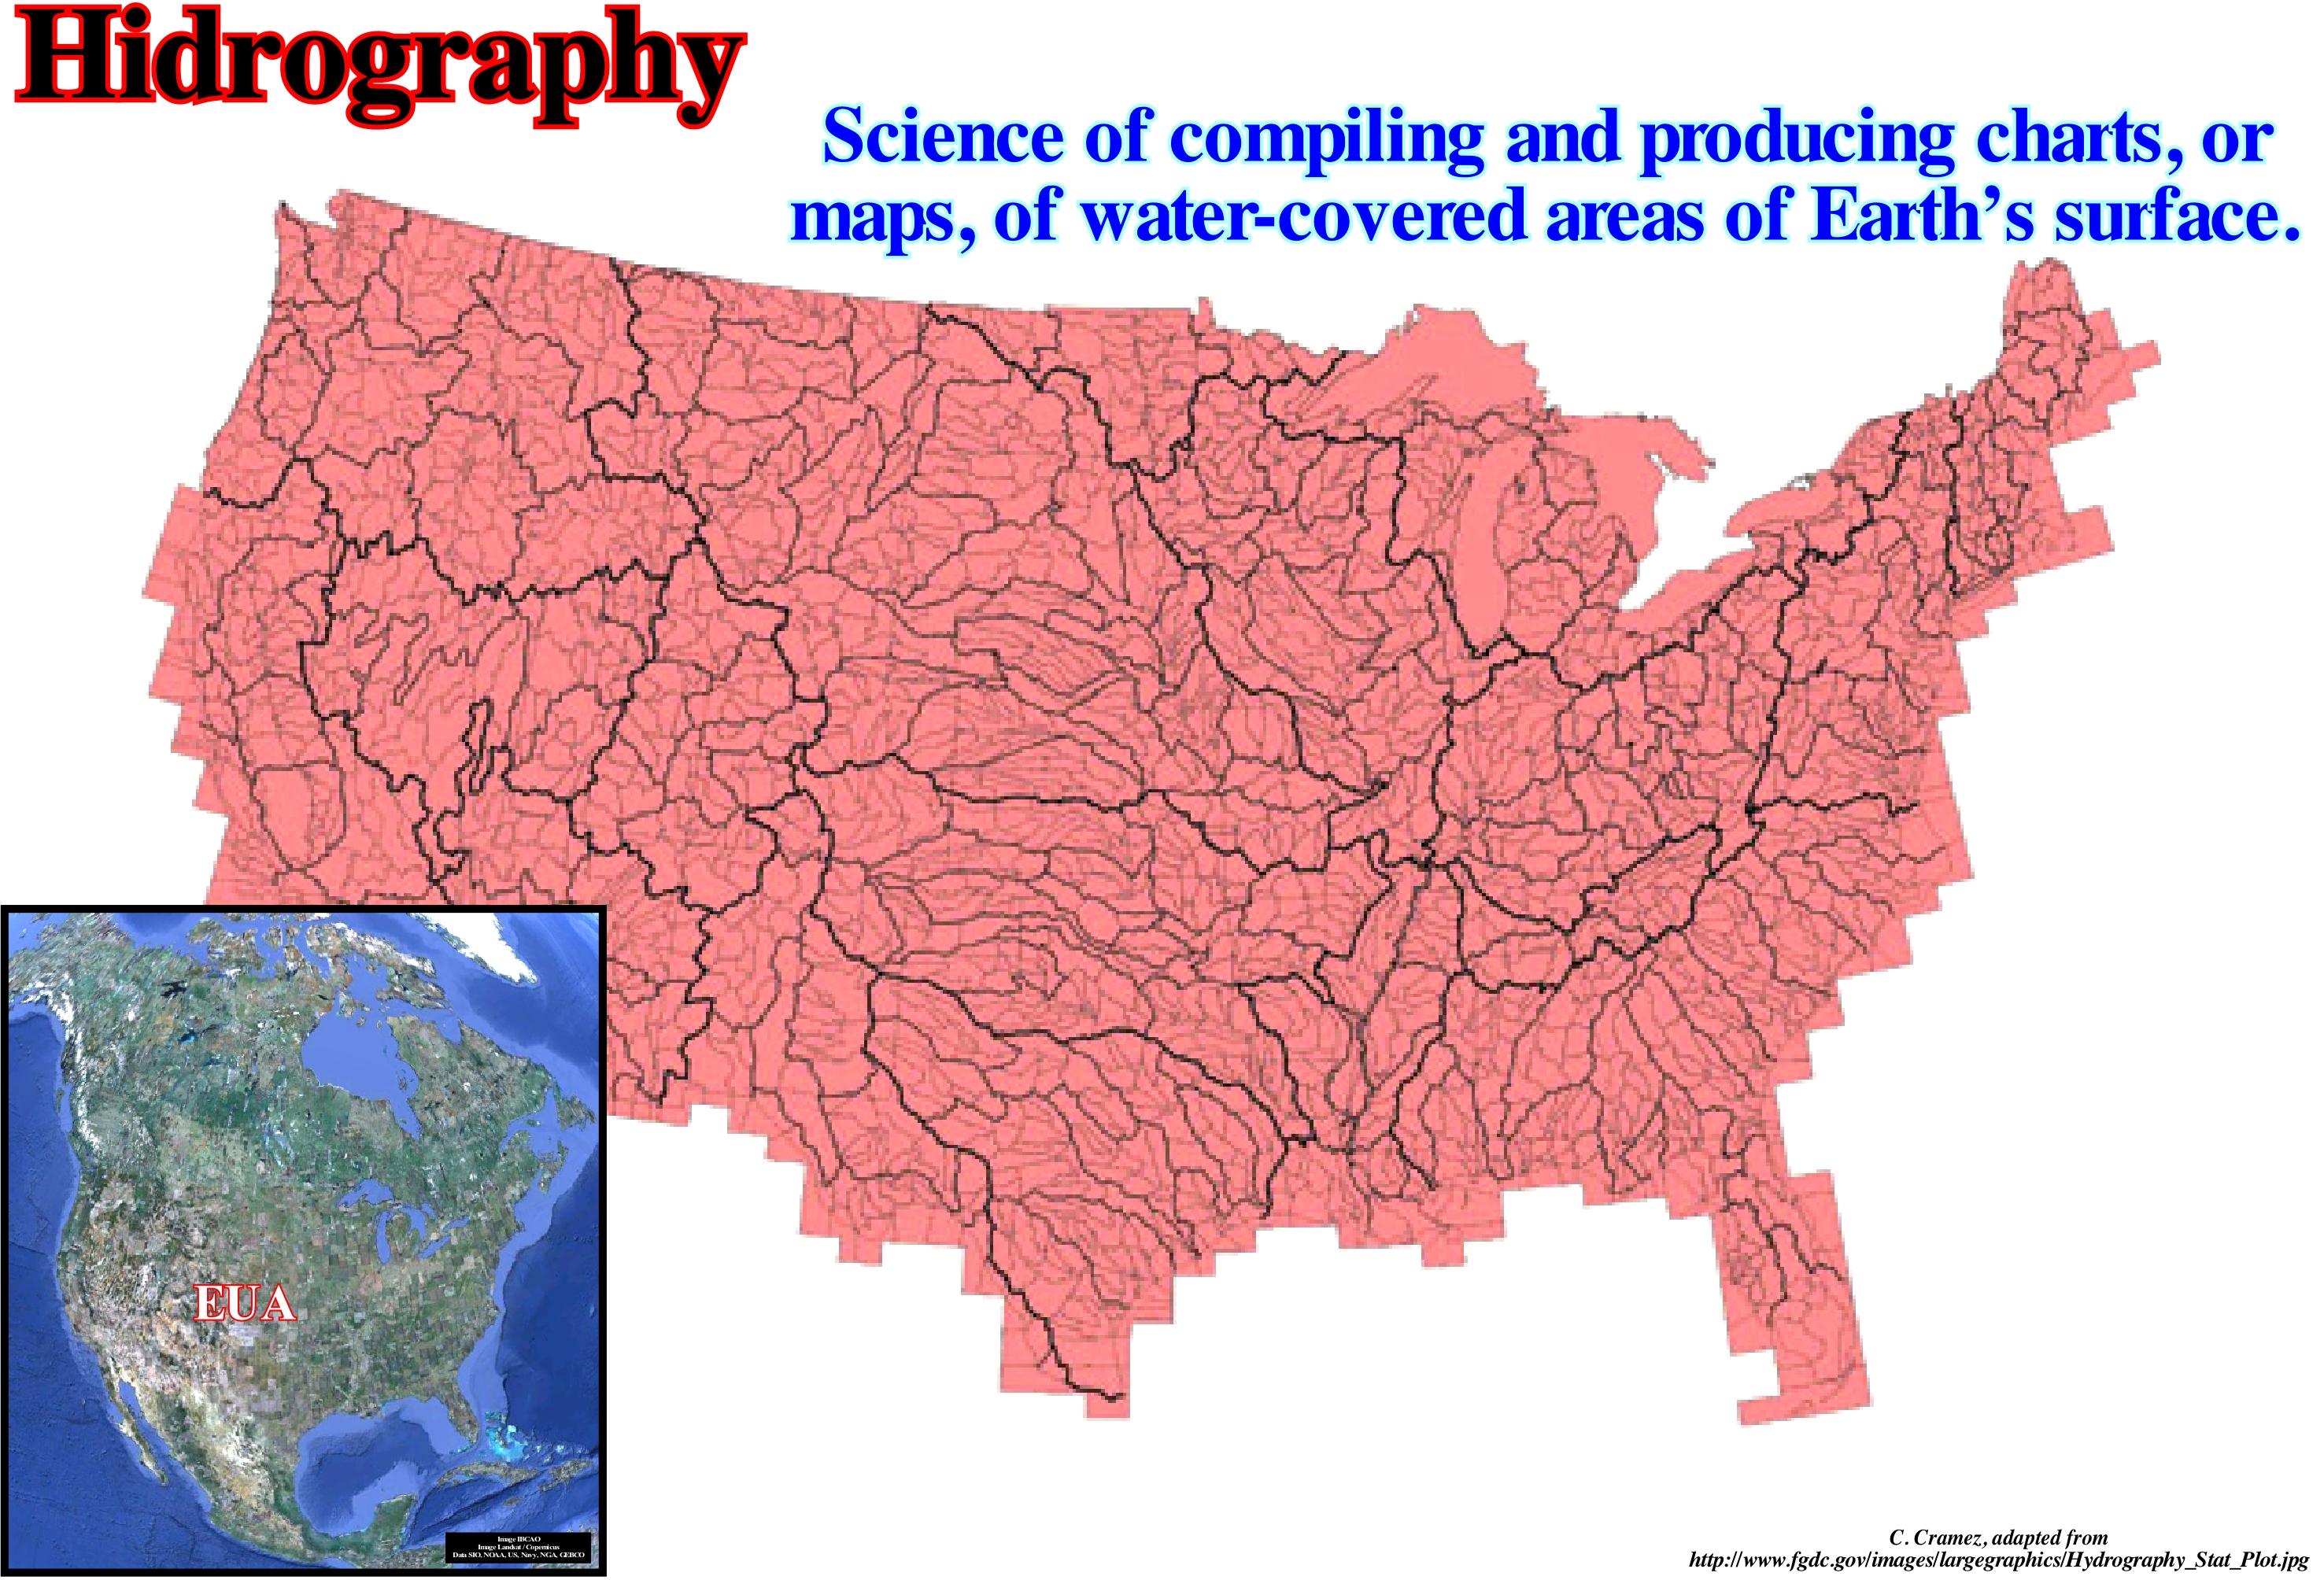
Hydrography is a part of the physical geography that classifies and studies the waters of the planet. The object of study of hydrography is the water of the Earth in all its forms, that is, oceans, seas, glaciers, groundwater, lakes, rivers and water of the atmosphere. Most of the water is, of course, concentrated in the oceans and seas, about 1380000000 km3, corresponding to more or less 97.3% of the world's water reserves. The total volume of inland waters is about 38000000 km3, representing 2.7% of the planet's water. On a large scale, hydrography is, usually ,performed by national or international organizations that sponsor the collection of data through accurate observations and the publication of charts and descriptive material, mainly for navigation purposes. Oceanography is, in part, a consequence of classical hydrography. In many respects, the data are interchangeable, but marine hydrographic data are, in particular, intended for maritime navigation and navigation safety. The exploitation of marine resources, especially oil research, uses hydrography in an intensive way. Historically, the hydrography was born with the elaboration of letters, graphs, drawings and notes made, individually, by the sailors. All of these documents, which were often privately owned and often held in secrecy, were used primarily to gain commercial or military advantage. Later, certain organizations, particularly, commercial ones acquired and perfected many of these individual data to distribute to their members, which gave them an organizational advantage. In the next stage, the majority of the members of these organizations were obliged to collect information, which allowed the development of hydrographic organizations dedicated basically to the collection, organization, publication and distribution of hydrography in the form of maps and road maps. River hydrography also includes, in particular, information on beds, flows, water quality and adjacent land.
Hydrologic Cycle..........................................................................................................................................................................Cycle hydrologique
Ciclo hidrológico / Ciclo hidrológico / Hydrologischen Zyklus / |水文循环 / Гидрологический цикл / Ciclo idrologico /
Cyclic movement of water from the ocean to the atmosphere and then to the Earth's surface (by rain), and then return to the sea either by direct flow or by surface currents or not.
See: « Relative Sea Level Change »
&
« Cycle »
&
« Depositional Base Level »
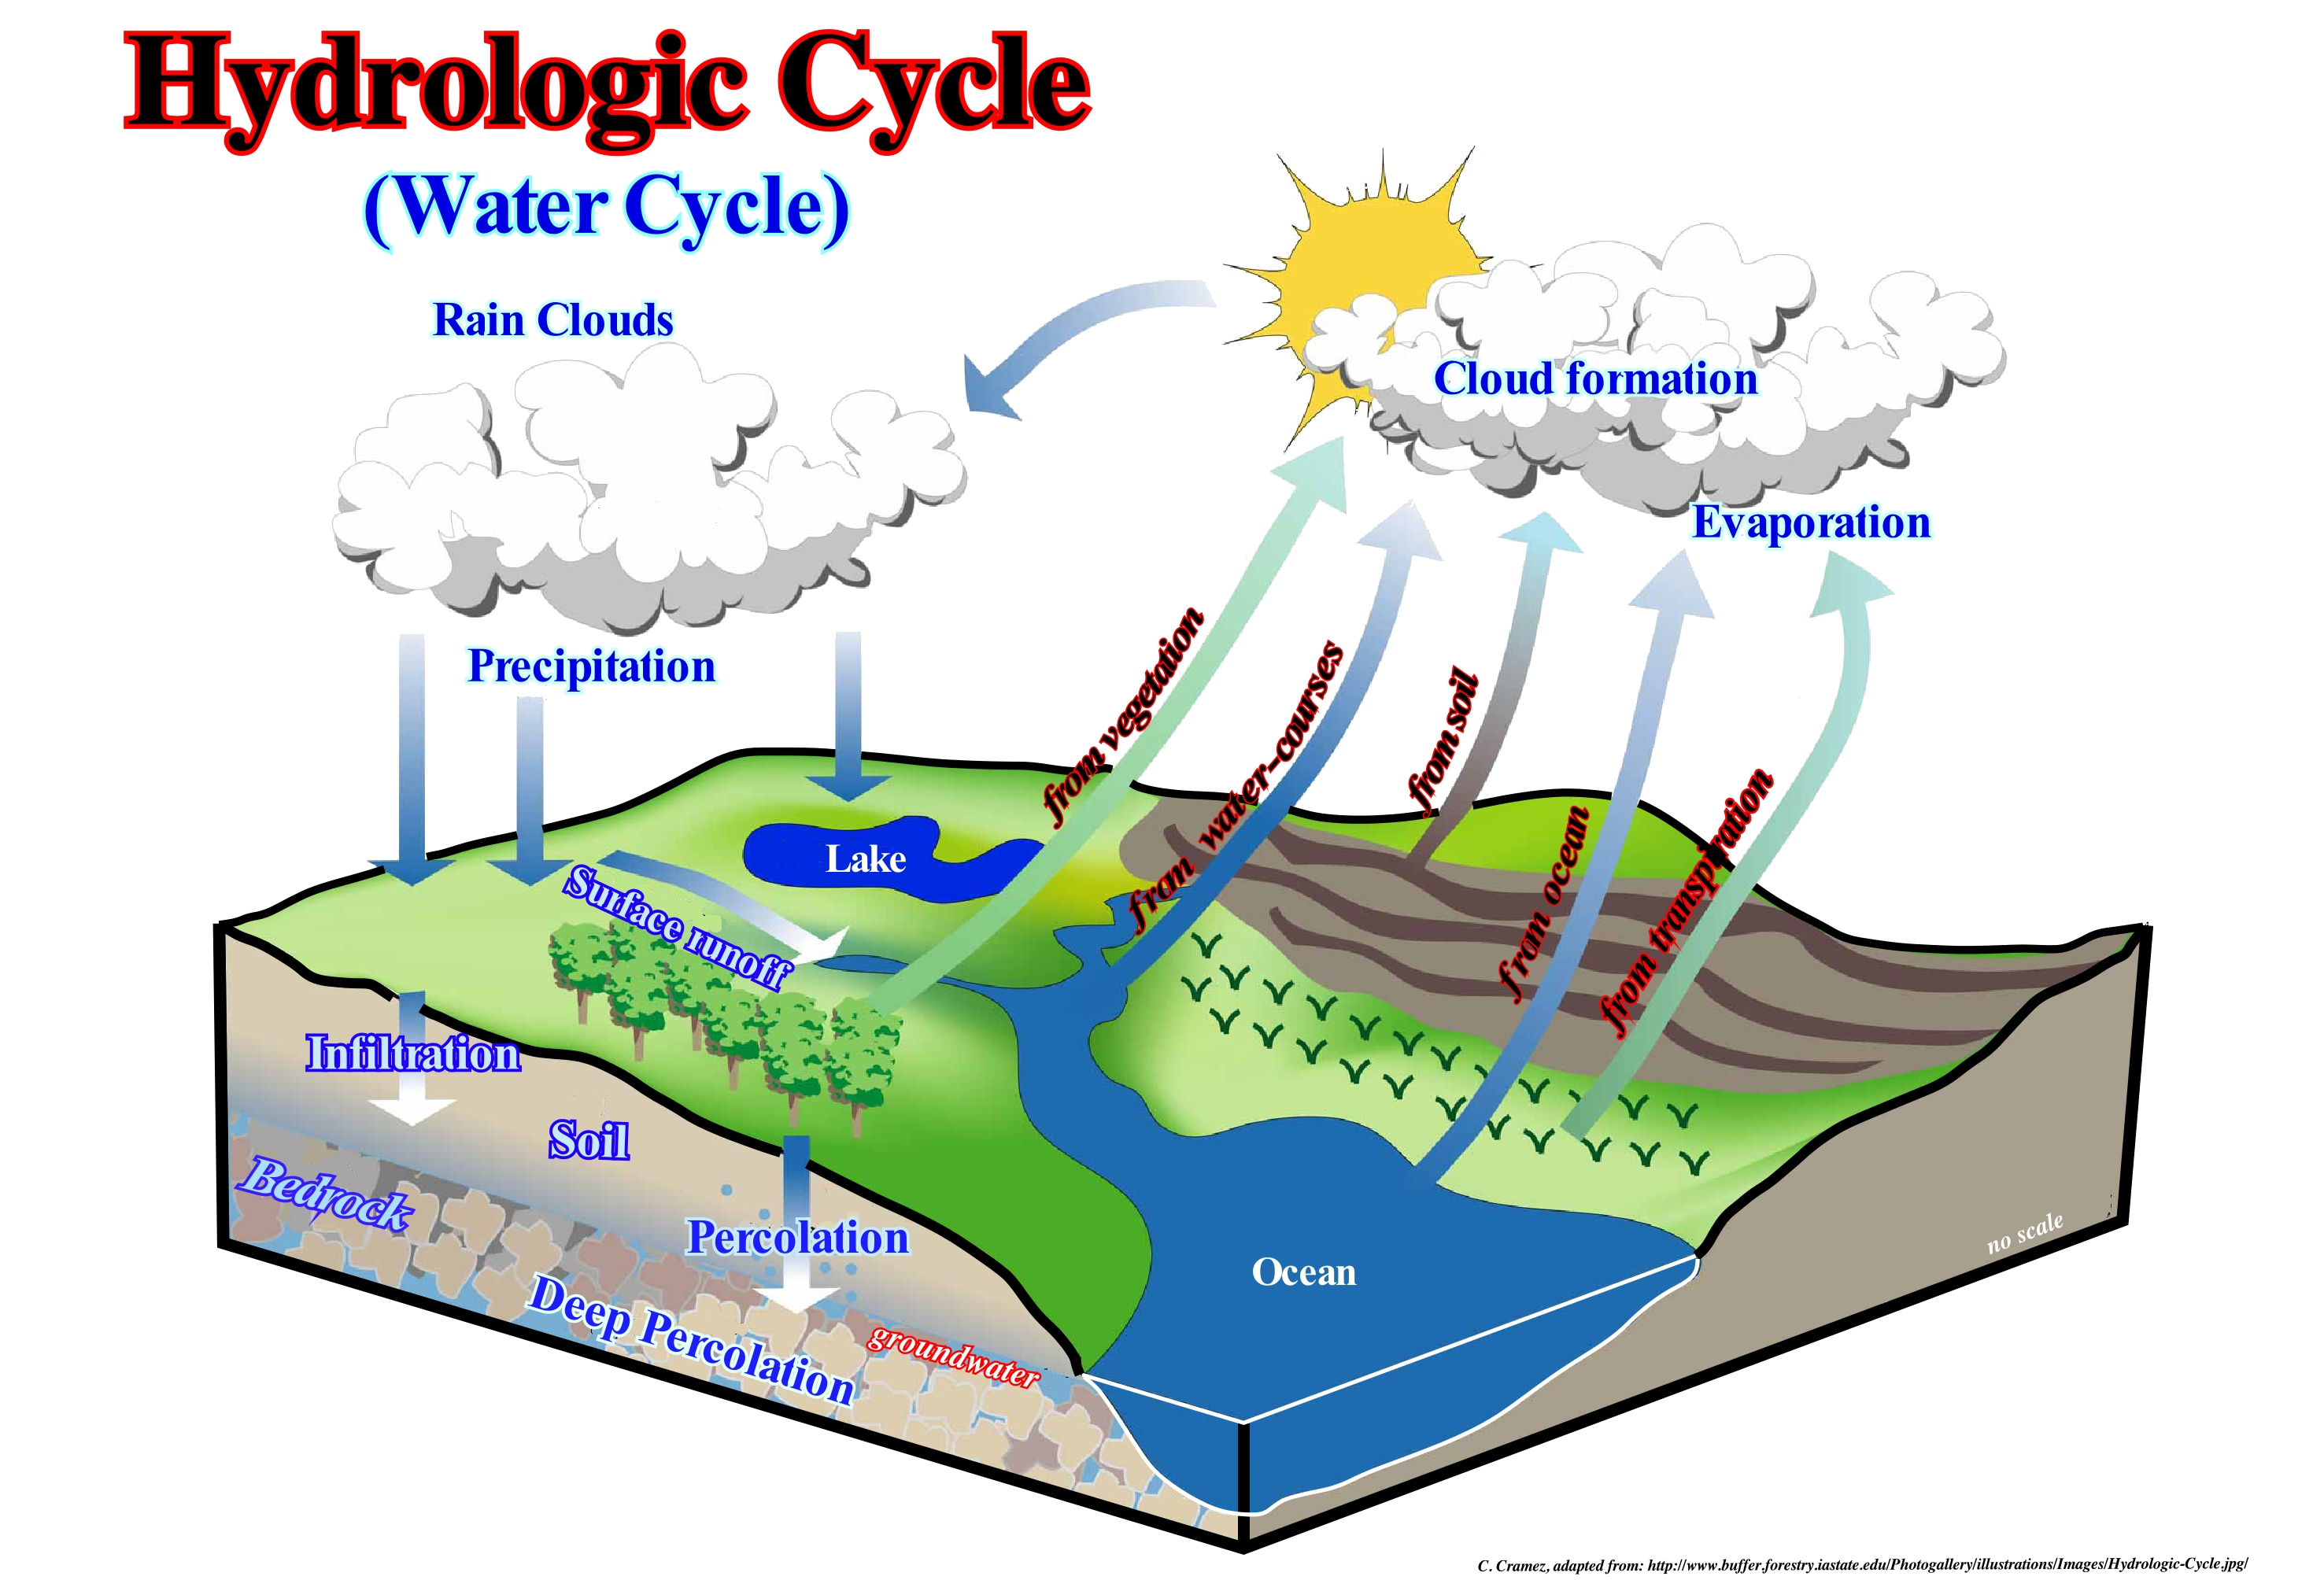
The term cycle designates, in ordinary language, a period in which a series of events or phenomena occur until it reaches a point from which events recur in the same order. In scientific language, it is said a cycle is a set of phenomena that occur in an orderly and repeated way, indefinitely, as for instance, the water or hydrological cycle, the cycle of the nitrogen or the sequence-cycle, to indicate the successive transformations of the physical or combination state that experiences water, nitrogen or sediment deposition in nature. Water is the source of all terrestrial life. Much of the Earth's water is either salty or inaccessible to man. Only about 3% of all water is fresh-water. In fact, from all fresh water, just 32% is not icy (groundwater represents about 30% and surface water about 2%). The water distribution is very uneven. Water exists on the Earth's surface in three states: (i) Solid ; (ii) Liquid and (iii) Gaseous. Geoscientists assume since the formation of the Earth, roughly, around 4.5 Ga (billion years), the amount of water in all its forms is constant. To this day, such a conjecture has withstood all refutation tests. It is one of the dogmas of sequential stratigraphy and eustasy (absolute or eustatic sea level changes, independently of its causes). In the hypothesis of the expanding Earth (S. Carrey, 1959), the present-time morphology would be the consequence of the expansion of the Earth, which in its origin was covered by a uniform continental crust was considered as primitive. The oceanic crust would have been formed along the scars produced by radial expansion. The ocean water would have been released from the mantle to keep sea level constant. This hypothesis, which has been falsified several times, implies a gradual variation of gravity, through geological time, as Earth expanded. Gravity varies, slightly, from place to place and is, correctly, described by the theory of relativity not as a force but as the consequence of the curvature of space-time caused by an uneven distribution of mass/energy. Water covers about 70% of the Earth's surface. The distribution of water on Earth is as follows: (i) The oceans represent about 97.3% of the total water, or about 1,350 x 1015 m3 ; (ii) The cryosphere, i.e., the regions of the Earth's surface, permanently, covered by ice and snow and that part of the ground containing ice represent about 2.1% of the total water, which in volume represents about 29 x 1015 m3; (iii) Groundwater accounts for about 0.6% of the total water, i.e. about 8.4 x 10¹⁵ m3; (iv) Lakes and rivers account for about 0.01% of the total water, i.e., about 0.2 x 10¹⁵ m3 ; (v) The atmosphere represents about 0.001% of the total water, i.e., about 0.013 x 10¹⁵ m3, finally (vi) The biosphere represents about 0.000004% of the total water, i.e., about 0.0006 x 10¹⁵ m3. When it is said the atmosphere contains less than 0.001% of the total water, this seems very surprising, since water plays a very important role in the climate. As the annual global precipitation is more than 30 times the total water retention capacity of the atmosphere, the recycling of water between the Earth's surface and atmosphere has to be rapid. It is the circulation and conservation of water, which is called the hydrological cycle, which functions more or less as follows: (a) The hydrological cycle begins with the evaporation of water (the process by which water changes from the liquid to the gaseous state) of the surface of the oceans * ; (b) As the humid air rises into the atmosphere, it cools and the water vapor condenses into clouds ; (c) Humidity is carried around the globe and returns to the surface of the Earth by precipitation (rainfall is the main form of precipitation, however, there are other forms of precipitation such as hail, snow, cold rain, etc.) ; (d) Once water reaches the ground, it may happen that a part of it evaporates, directly, and leaves again into the atmosphere or that infiltrates into the ground and turns into groundwater (either in the aeration zone or in the saturation zone, which are separated by the water table or hydrostatic level) by percolation** ; (e) Groundwater, in turn, flows into the oceans, rivers or streams or distributes directly into the atmosphere through transpiration (evaporation of water into the atmosphere by the leaves and trunks of plants) ; (f) Water, which remains at the Earth's surface, flows into lakes and streams and is transported back to the oceans where a new hydrological cycle begins.
(*) About 80% of the water evaporates from oceans. The remaining 20% comes from terrestrial bodies of water and plants.
(**) In geology, the term percolation refers to the passage of water through the soil and permeable rocks flowing into underground reservoirs or aquifers. In other disciplines, such as in pharmacology, percolation refers to the extraction of soluble components passing solvents through porous materials.
Hydrology...............................................................................................................................................................................................................................Hydrologie
Hidrologia / Hidrología / Hydrologie / 水文学 / Гидрология / Idrologia /
Science of the hydrological cycle, i.e.., the cyclical movement of water from the oceans to the atmosphere, from the atmosphere to the Earth's surface, from the Earth's surface to the drainage and groundwater currents, and, finally, to the oceans again. Hydrology is the study of the movement, distribution and characteristics of water on and under the continents.
See: « Hidrologic Cycle »
&
« Hypogenic Water »
&
« Juvenile Water »
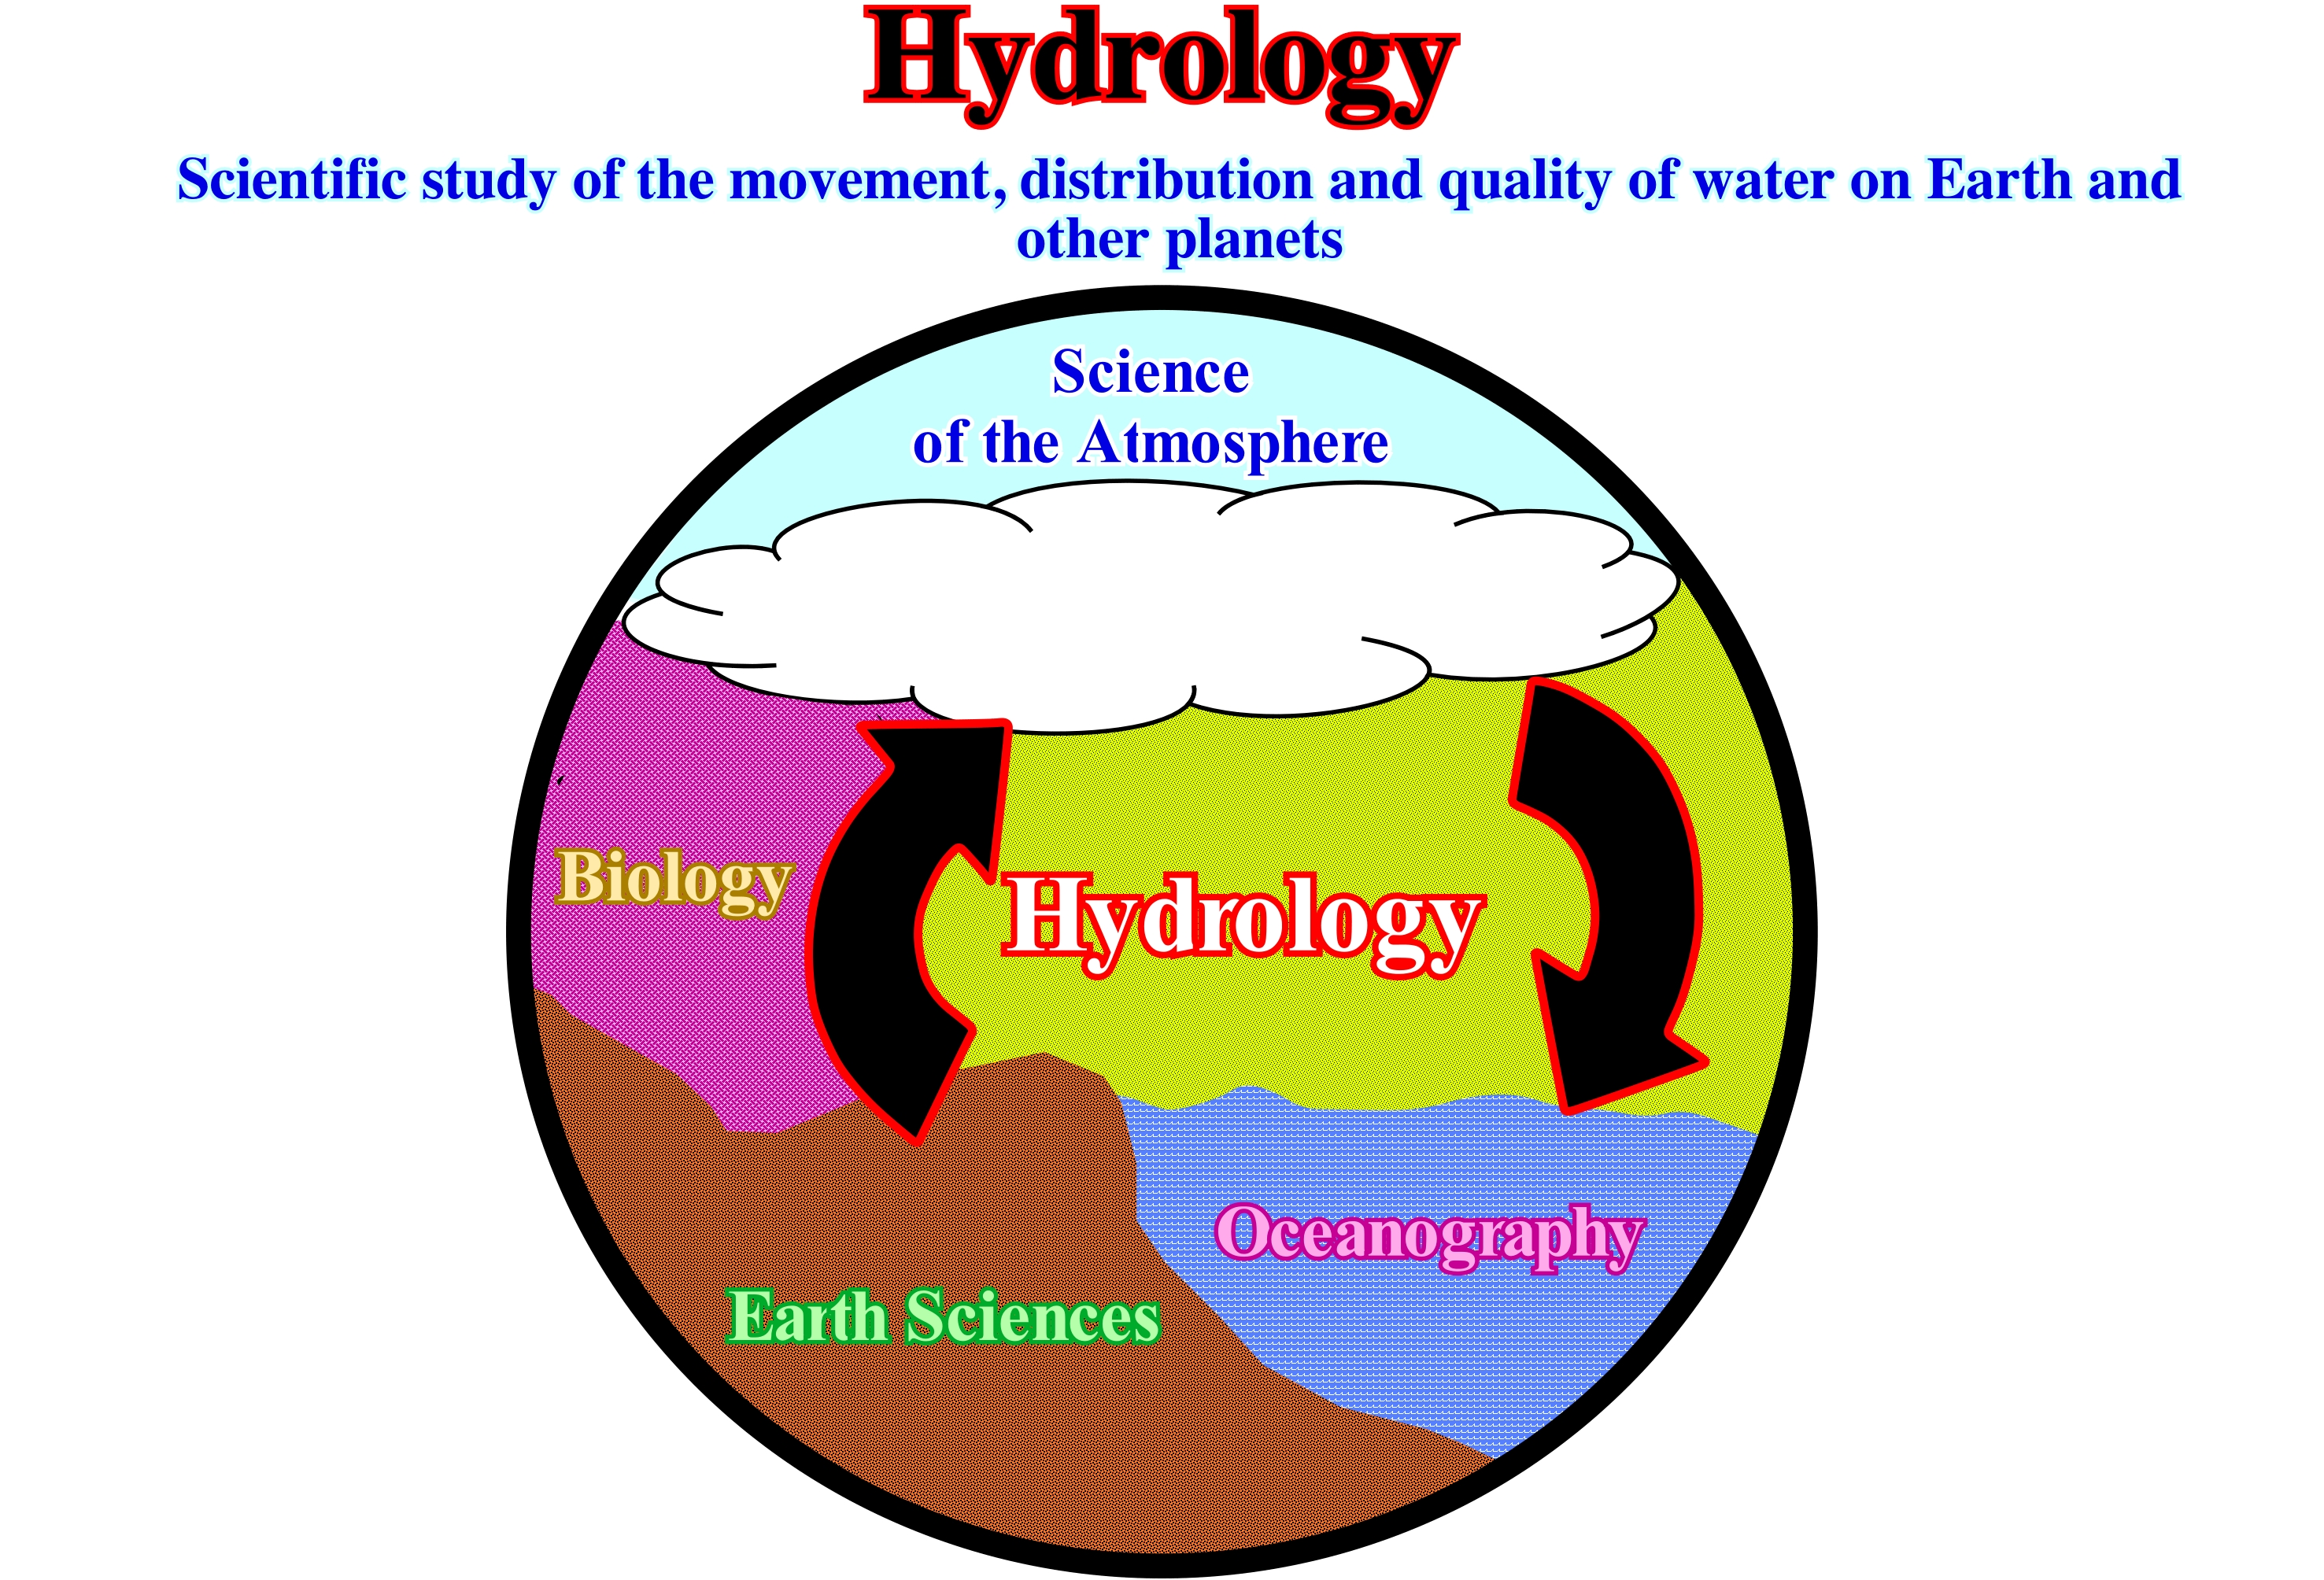
The hydrological cycle is the movement of water above, on and below the Earth's surface. The hydrological cycle is the cycle that replenishes groundwater sources. Theoretically, the hydrological cycle begins with the evaporation of water, into the atmosphere, from oceans, rivers, lakes, glaciers, vegetation, soils, etc. This process is called evaporatranspiration. Since the water condenses to form the clouds, it returns to the earth by precipitation, either by rain, hail or snow. The precipitation fell on the Earth's surface and seeps into the ground or seeps into the ground. When it infiltrates the soil, it is referred to as infiltration. When it flows to the Earth's surface it is referred to as drainage. The amount of precipitation that infiltrates, in relation to the amount of water, that flows on the surface of the Earth, varies according to several factors: (i) Amount of water present in the soil ; (ii) Soil composition ; (iii) Plant cover and, of course; (iv) Slope of the terrain. In the vast majority of cases, the surface runoff encounters a stream or any other mass of water (lake, ocean, etc.) where the water enters, to evaporate again into the atmosphere. The water that infiltrates the soil, flows under the action of gravity through particles that form the soil and fissures. If the soil is very dry, the water is absorbed until it is wet. Since it gets wet, excess infiltration begins to move towards the water table (hydrostatic level). Since the water reaches the hydrostatic level, water becomes part of groundwater. Many of the rocks located near the Earth's surface are porous and fractured. All the water beneath the Earth's surface that flows through the pores and fissures of the earth is known as underground water. The water moves downward and laterally to reach, eventually, an exudation, spring, source or even the sea, where, again, it will evaporate to restart a new hydrological cycle.
Hydrophyte (Organism)......................................................................................................................................................................................Hydrophyte
Hidrófito / Hidrófito / Hydrophitisch / 水生植物 / Гидрофит / Idrofite /
An organism that lives in water or in an environment saturated with water. The term hydrophyte is mainly used for plants.
See : « Hemipelagic (organism) »
&
« Helophyte (organism) »
&
« Accommodation »
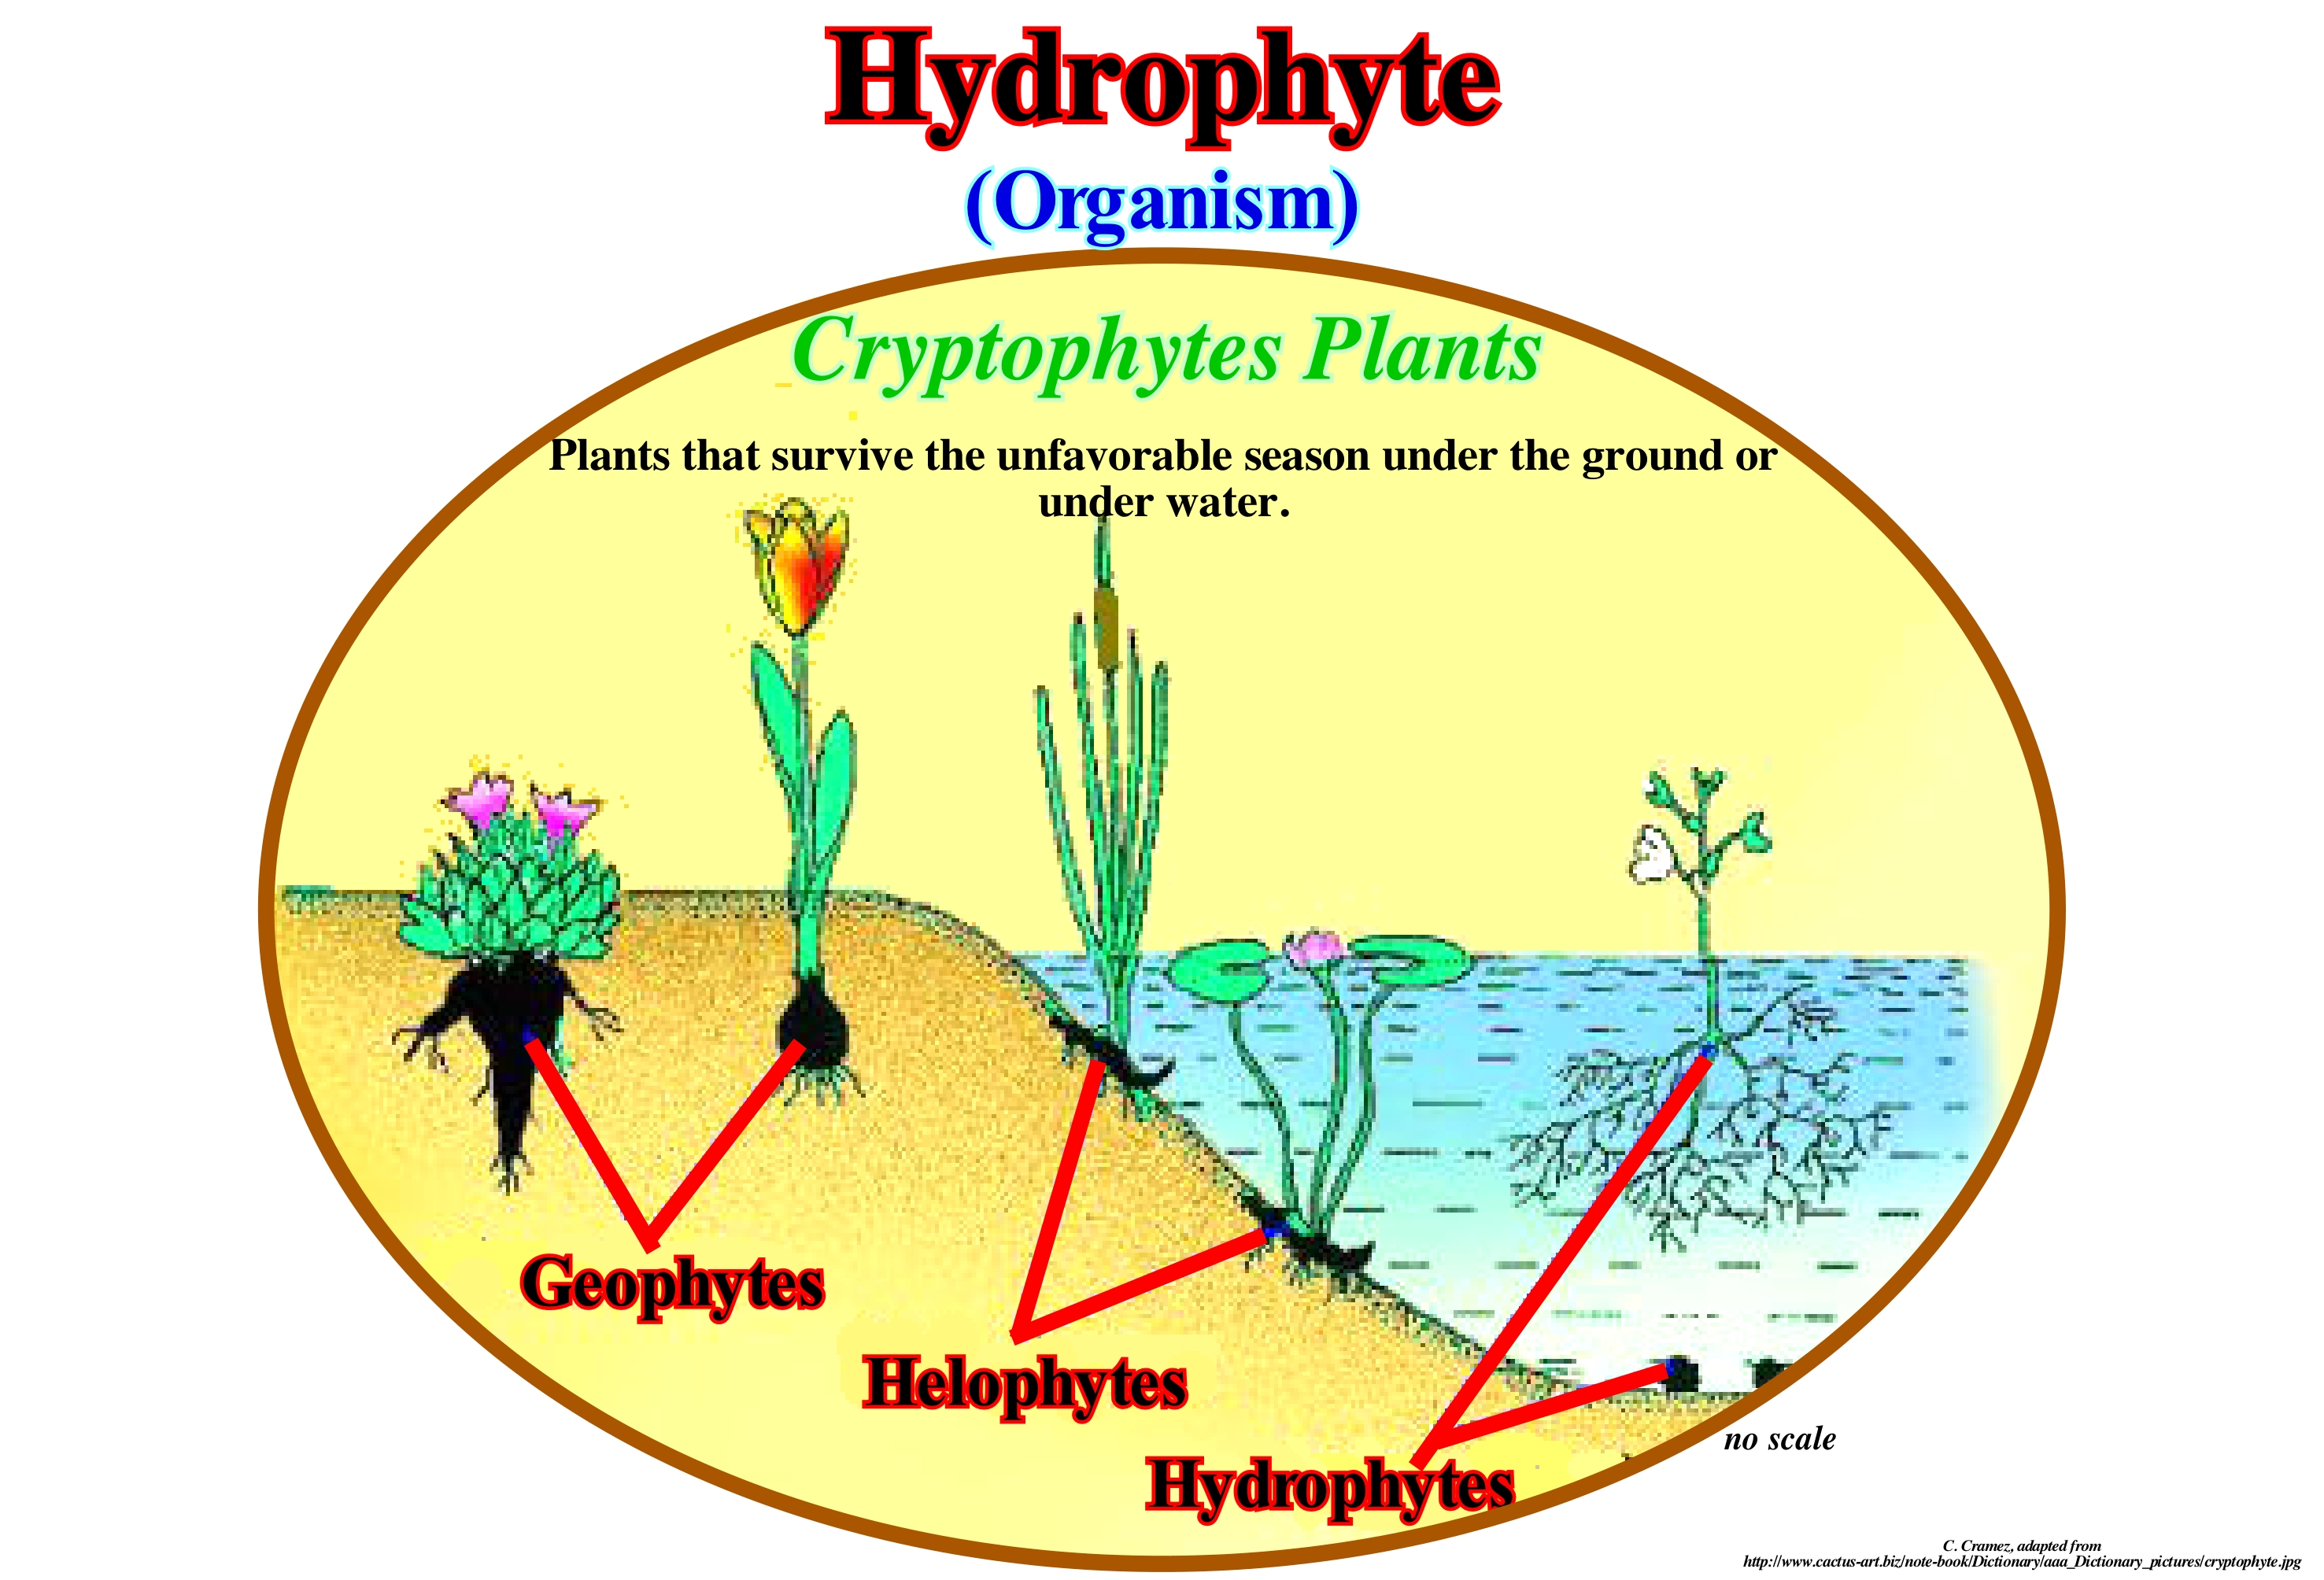
As illustrated in this figure the hydrophyte plants, i.e., the plants that live the unfavourable season under the ground or water, may be: (i) Geophytes ; (ii) Helophytes and (iii) Hydrophilic. Geophytes have succulent subterranean organs such as rhizomes, bulbs or tubers and which in the rains can rapidly develop an aerial part using the stored carbohydrates to flower and fruit in a short period of time. Helophytes grow in wetland habitats or along rivers and riverbanks. Hydrophilic (also known as aquatic macrophytes) live with a portion of their vegetative part, permanently immersed in water (the term hydrophyte refers to both algae and vascular plants). The hydrophytes have a number of adaptations to their environment. In the case of some trees, the roots may be endowed with pneumatophores, which capture atmospheric oxygen for their respiration. Herbaceous and rhizomatous plants can be presented in three ways: (a) Floating (when their roots do not stick to the bottom and the whole plant remains floating on the surface) ; (b) Semisubmerged (when part of the plant remains out of the water, but at least the roots are attached to the bottom) and (c) Submerged (when the roots are fixed to the bottom and the whole plant body remains under water). Each of these types presents a range of characteristics appropriate to their way of life. Floating plants are, usually, endowed with aerenchyma*, which make their weight lighter; also have short and simple roots, and great perspiration index. The semisubmersibles, usually, have short stems or subterranean rhizomes, attached to the substrate, and long leaves or petioles that keep their leaves out of the water. These leaves have stomates on the upper face of the leaves, rather than the lower one, which is the most usual. The submersibles present very fine and delicate fabrics, usually with small sheets, in the form of strip, or band (fringed), without any type of support fabric. The flowers sometimes remain submerged, although this is not a rule.
(*) Tissue composed of inflated cells or large inter-cellular spaces, forming large cavities inside the plant filled with air.
Hydrosphere.............................................................................................................................................................................................................Hydrosphère
Hidrosfera / Hidrosfera / Hydrosphäre / 水圈 / Гидросфера / Idrosfera /
Earth water in all forms, i.e., water from the lithosphere (rocks), cryosphere (ice), atmosphere (air) and biosphere (living organisms).
See: « Cryosphere »
&
« Lithostratigraphy »
&
« Relative Sea Level Change »
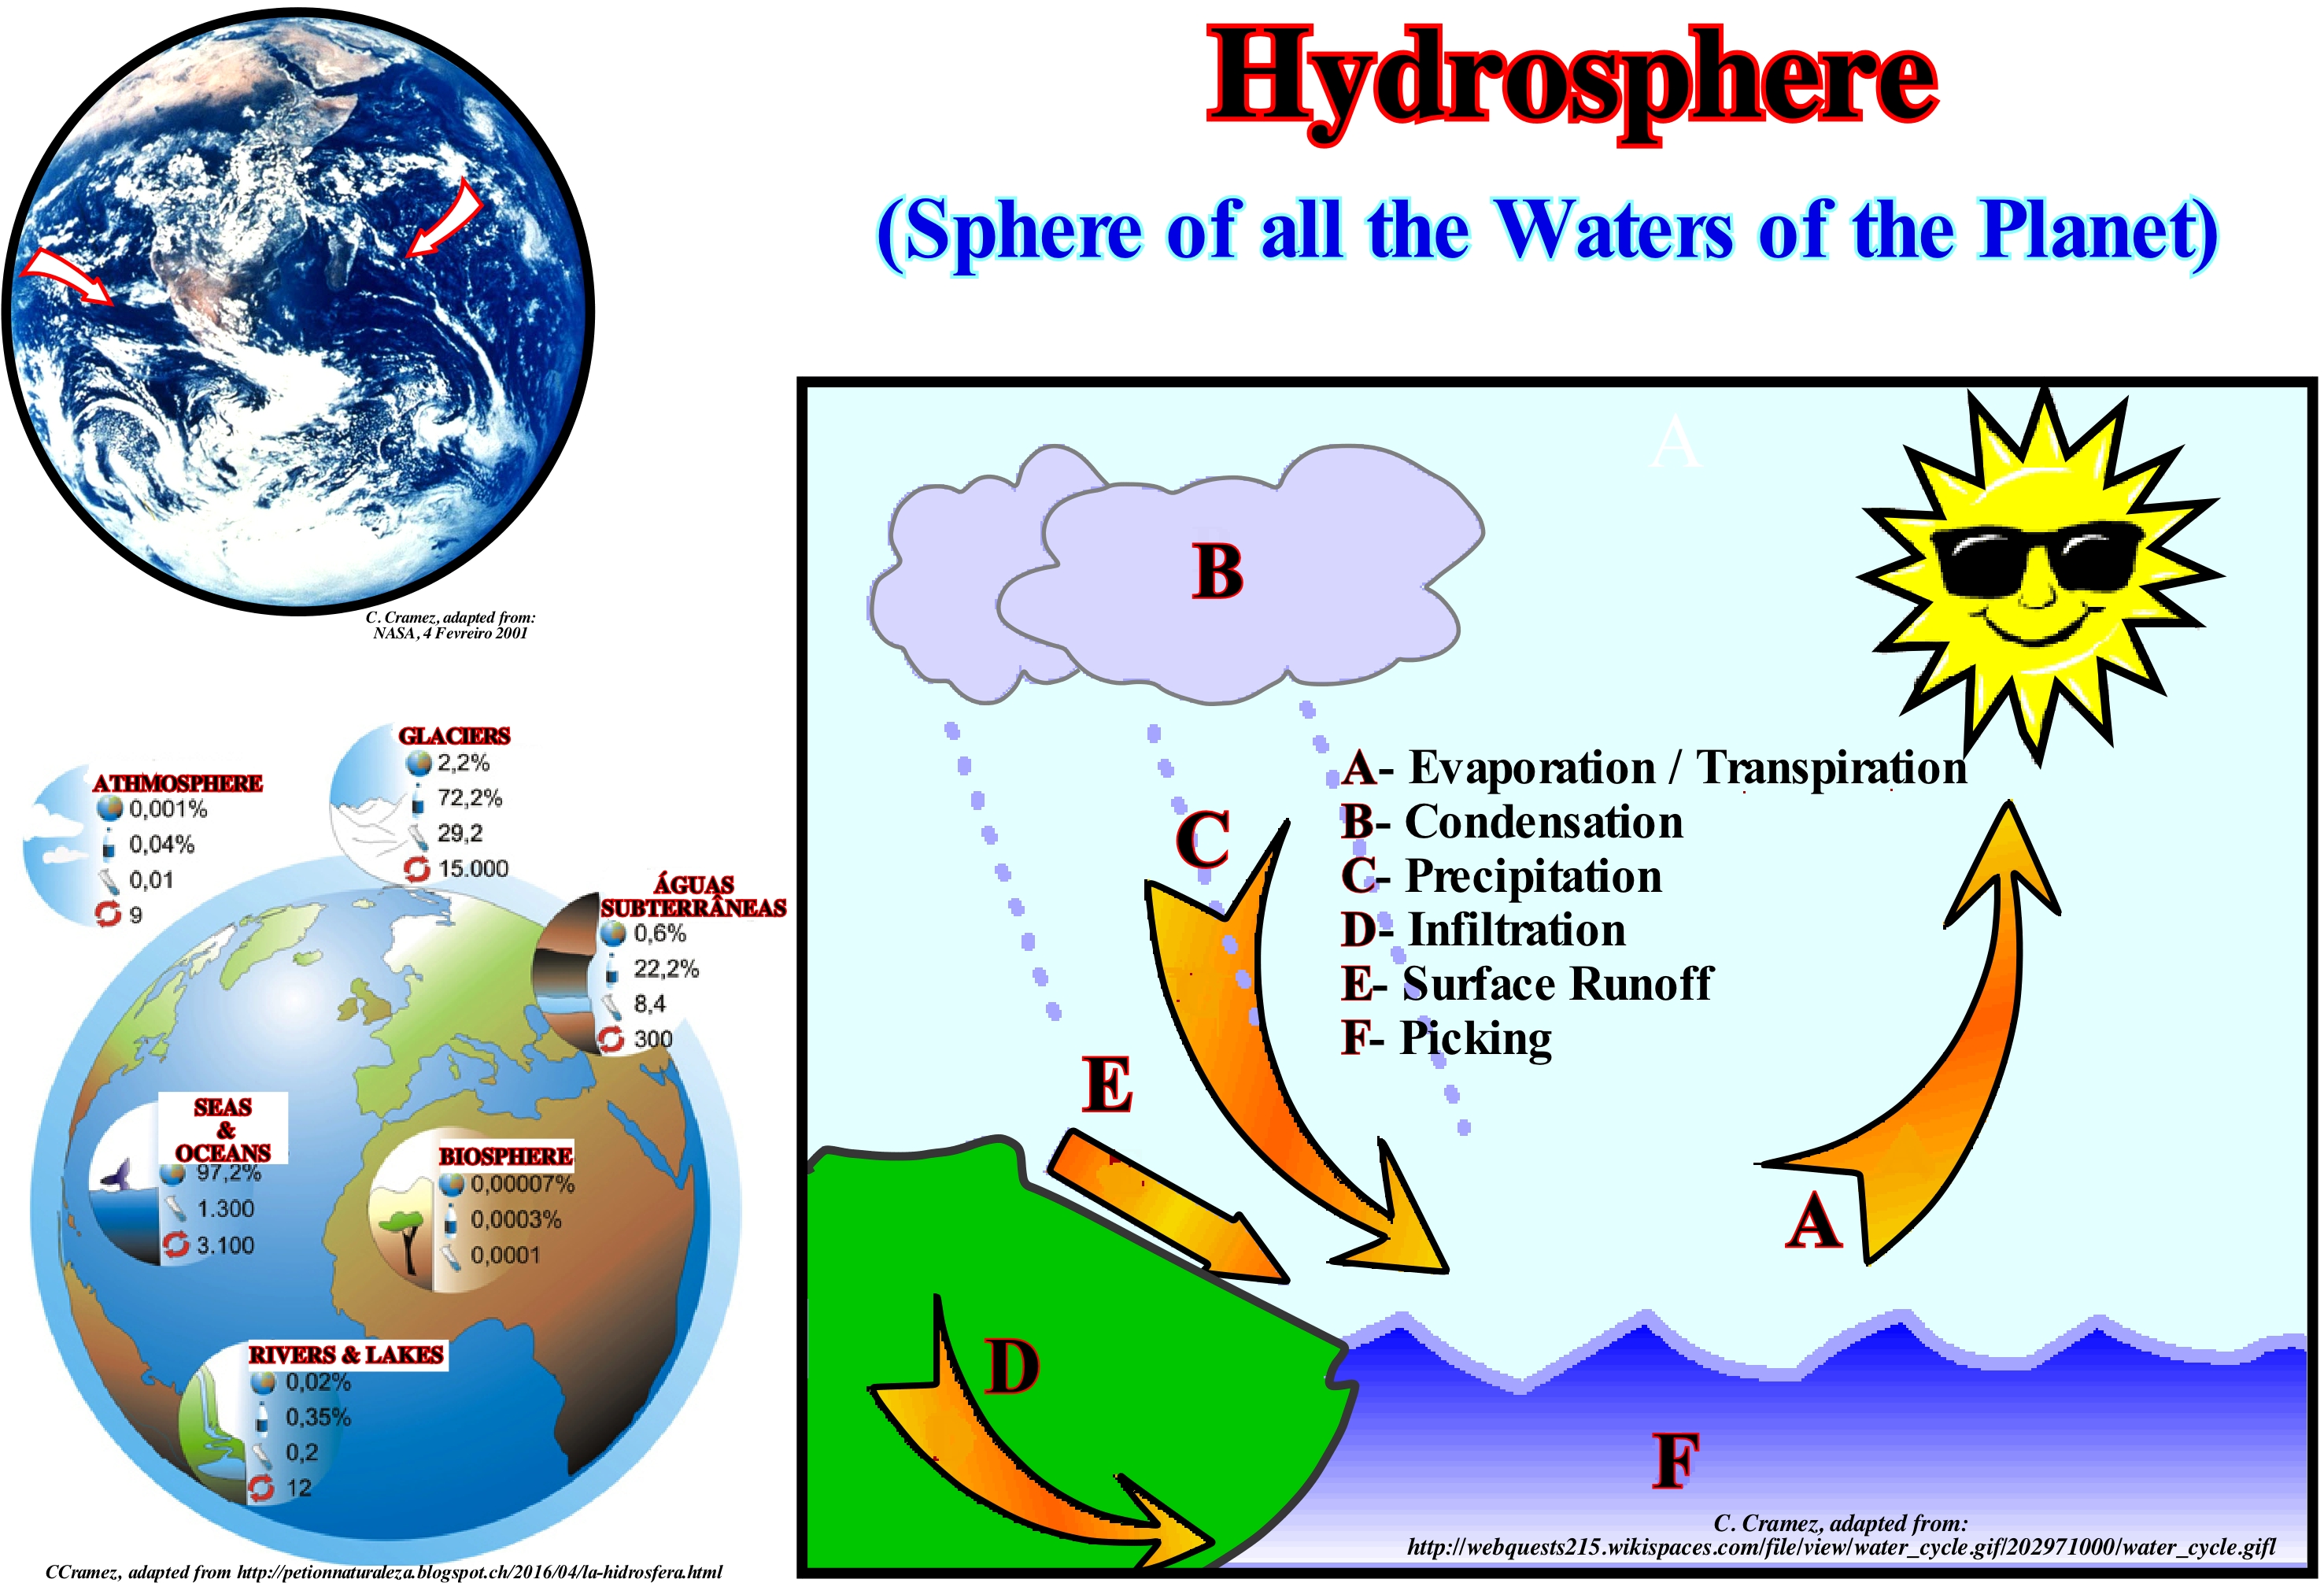
The hydrosphere includes all the water on Earth. In fact, 71% of the Earth is covered with water and only 29% corresponds to land. The abundance of water on Earth is a unique feature. It distinguishes our planet from the other planets in the solar system. The most likely reason for the presence of water on Earth is that it has mass, chemical composition and just atmosphere. On the other hand, the Earth is at just distance from the Sun, which allows water to exist in liquid form. The variations of temperature and pressure on our planet allow water to exist in three states: (i) Solid (ice) ; (ii) Liquid (water) and (iii) Gaseous (water vapour). Most of the water is contained in the oceans (1.35 M km3). The high heat capacity of this large body of water protects the Earth's surface from major changes in temperature. The amount of water on Earth is limited, since it is constant. Geoscientists think the amount of water (in all its forms) is constant since the formation of the Earth. This conjecture explains the eustatic cycles associated with the rupture of the supercontinents (1st order eustatic cycles). The movement of water through the hydrosphere, as illustrated in the diagram on the right, is called the water cycle or hydrological cycle. This cycle can be divided into six parts: (a) Evaporation/Transpiration ; (b) Condensation ; (c) Precipitation ; (iv) Infiltration ; (v) Flow and (vi) Harvest. Condensation occurs when water vapour condenses into the atmosphere to form clouds. When the air cools sufficiently, the water vapour condenses in the air into particles to form the clouds. Since the clouds form, the wind moves them across the earth's surface, spreading water vapor. When the clouds can not contain more moisture, they release the water in the form of precipitation, which can be rain, snow, hail, etc. Infiltration, runoff and evaporation occur at the same time. Infiltration occurs when precipitation falls on the ground. If the precipitation is faster than the infiltration it begins to seep into a body of water. The same happens to groundwater. Evaporation changes the liquid water from bodies of water into gas that rises in the atmosphere to condense later.
Hydroturbation........................................................................................................................................................................................Hidroturbation
Hydroturbação / Hidroturbación / Hydroturbation / Hydroturbation (土壤,由于水的混合物) / Гидротурбация / Idroturbazione (miscela di suolo a causa di acqua)/
Deformation of sedimentary structures, surface formations or soils due to changes in moisture content, especially in clayey rocks and silt. Synonym of Peloturvation.
See: « Turbidite »
&
« Compaction »
&
« Clay »
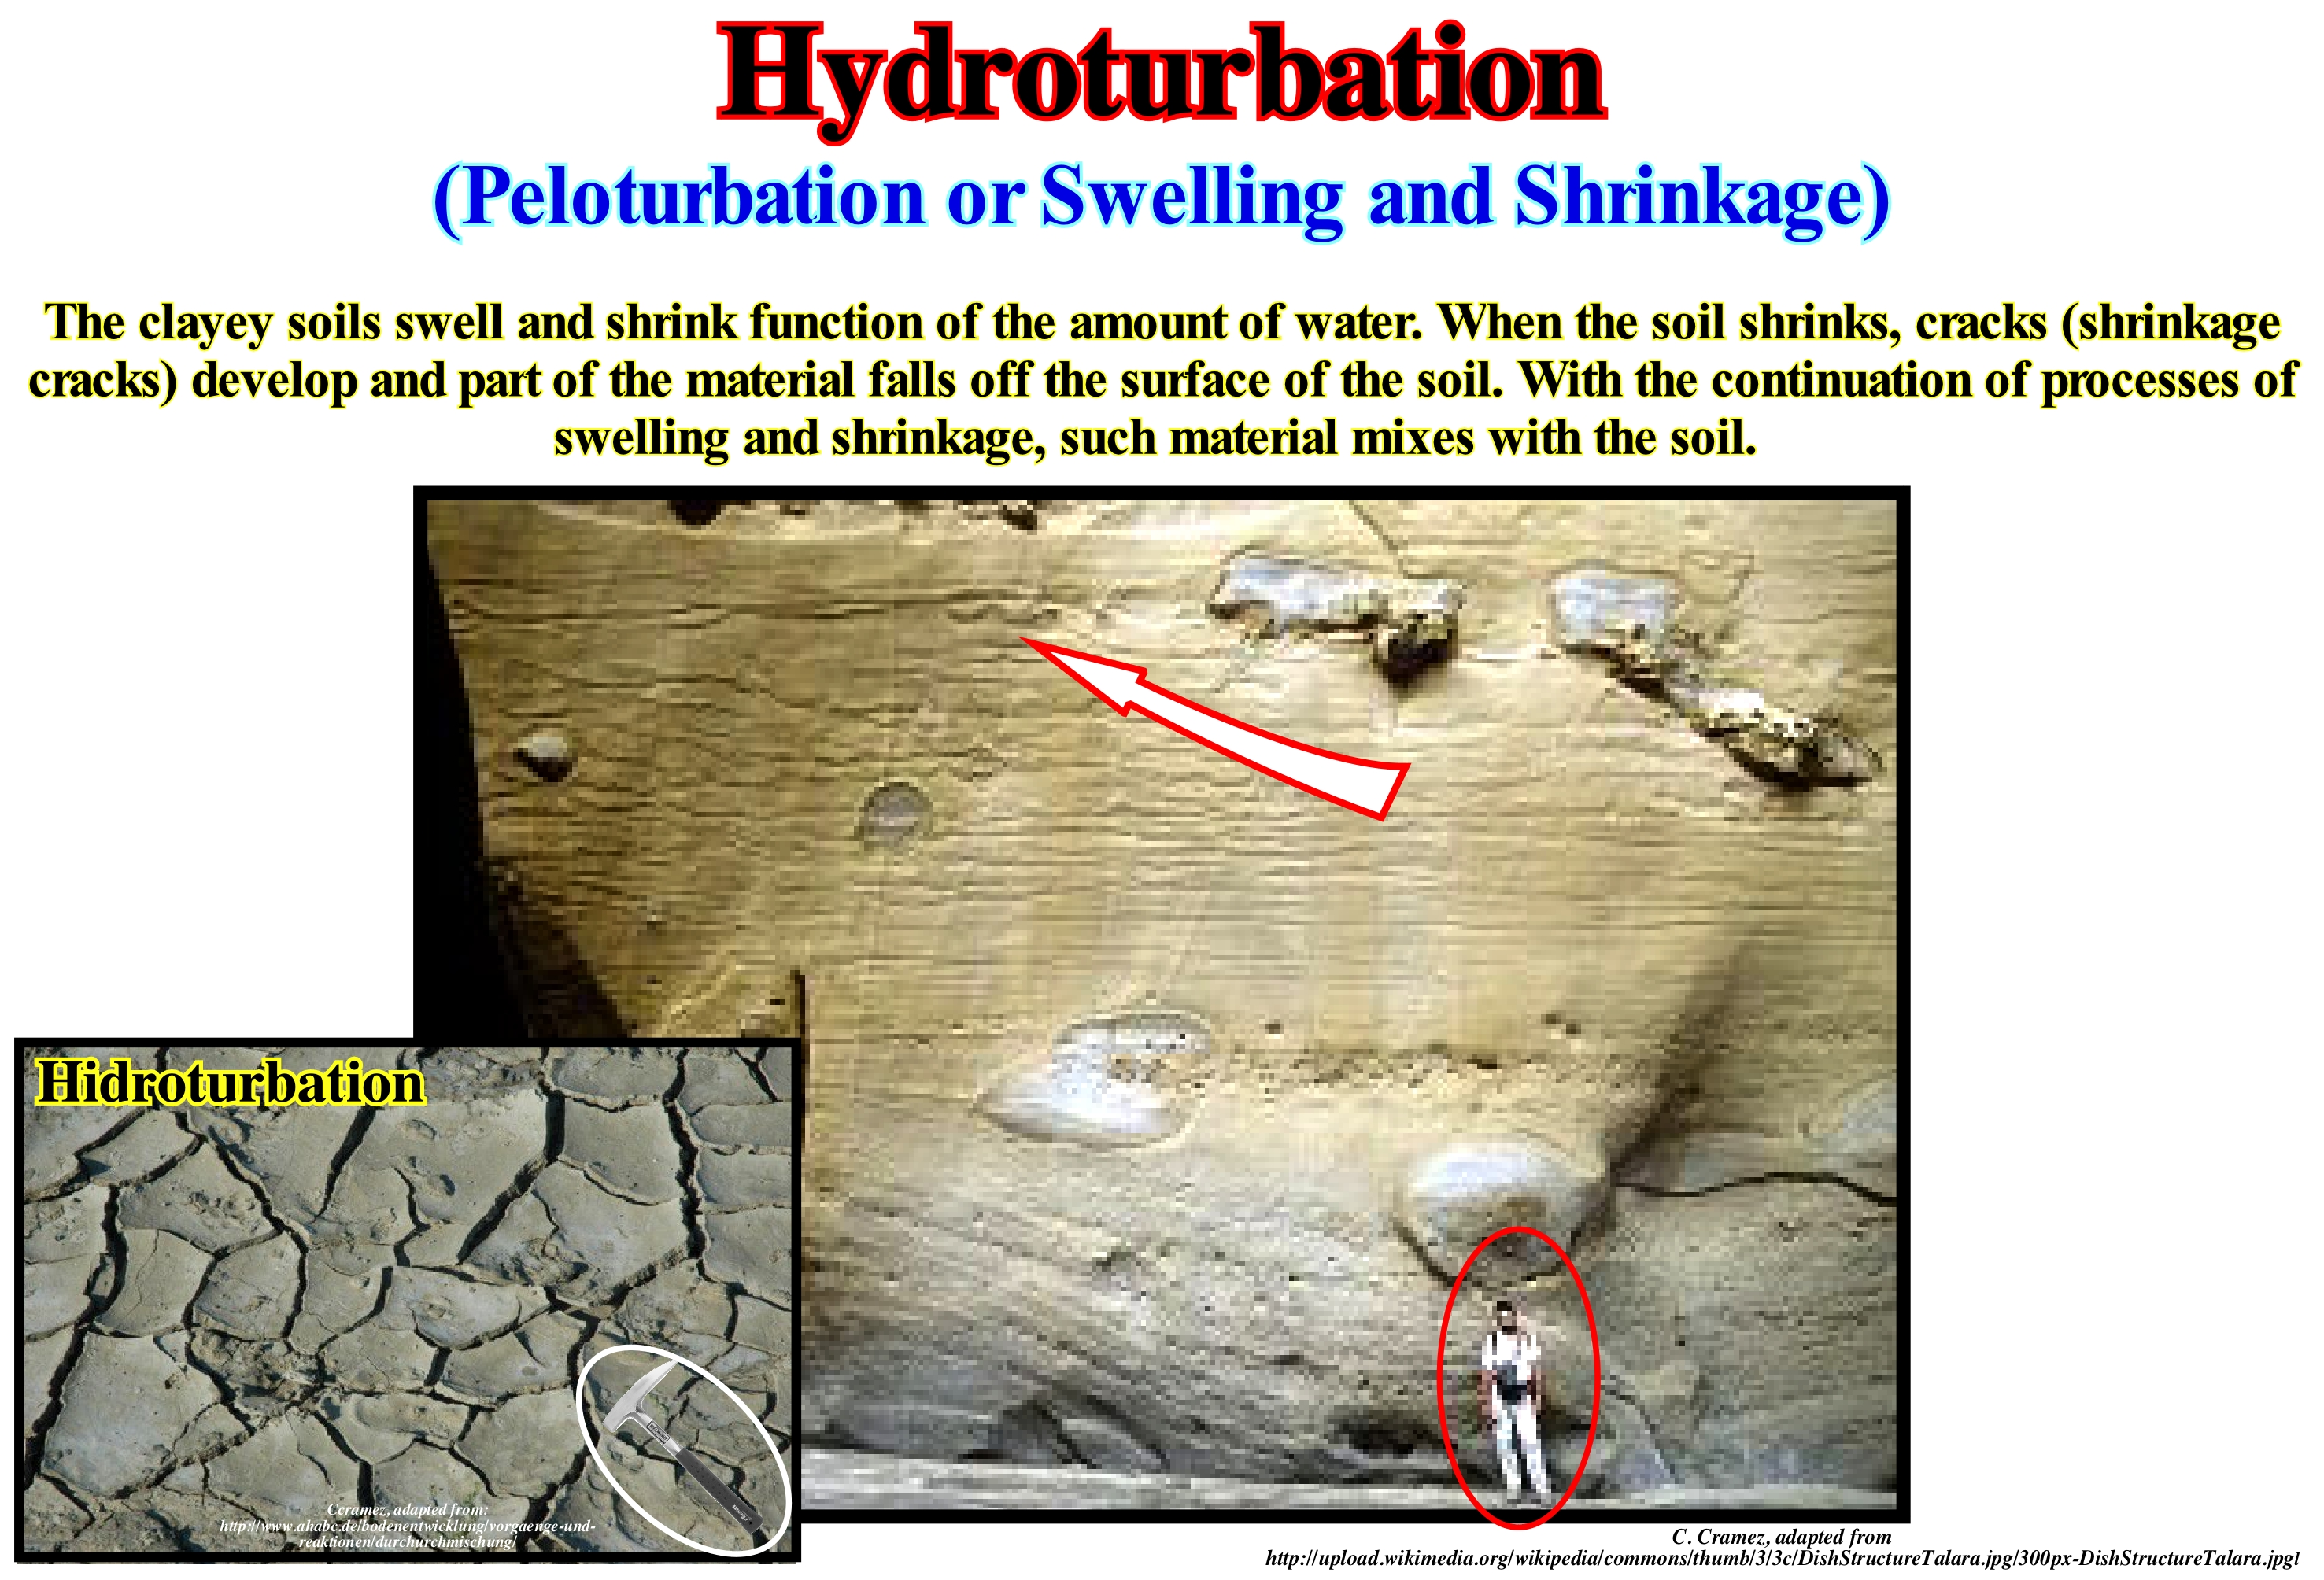
The hydroturbation designates, mainly, the deformation of a soil under the action of hydration and dehydration, as, for instance, the dissecting slits are the result of the hydroturbation. When the water content or the increase of pressure causes hydroturbation or peloturbation, certain geoscientists think it is due to the processes of expansion and contraction of the clay minerals. Soil columns develop where clay minerals are washed away. On the surface a structure of microswellings occurs next to micro-cavity (micro-turbation). Do not confuse hydroturbation with bioturbation. Bioturbation results from the mixing of soils by organisms. This mixture creates an expansion of the soil horizons as well as a lubrication of the transition horizons. Bioturbation produces secondary porosity, which plays a crucial role in water conductivity especially in fine soils. Bioturbation processes promote the formation of complex humus, which stabilize and increase the fertility of soils. Anthropogenic cultivation of soils is part of bioturbation, although, conventionally, it is not taken into account by geoscientists. Also do not confuse hydroturbation with cryoturbation, which is a disturbance, that is, a set of processes of mixing sediments or horizons of a soil, caused by ice and in which the effects of physical decomposition are the same as during an ice fracturing (cryoclastic). This photograph represents an outcrop of a deep turbidite sandy interval (submarine basin floor fans) deposited following a relative sea level fall that puts sea level lower than the basin edge, i.e., that changed the geological conditions from highstand to lowstand geological conditions. In this clayey horizon that underlines the age of the erosion surface (unconformity) induced by the relative sea level fall, it is easy to recognize the deformations of the sediments (convex upwards) induced by a water escape, which filled the porosity of the sands, due to compression (exhaust figures).
Hygrophyte (Organism)......................................................................................................................................................................................Hygrophyte
Higrófito / Higrófito / Hygrophitisch / 湿生植物 / Гигрофит / Igrofite /
Organism that lives in a humid, saturated or almost humid atmosphere. A hygrophyte organism is, practically, synonymous of a hydrophyte organism.
See: « Sedimentary Environment »
&
« Hydrophyte »
&
« Hemipelagic (organism) »
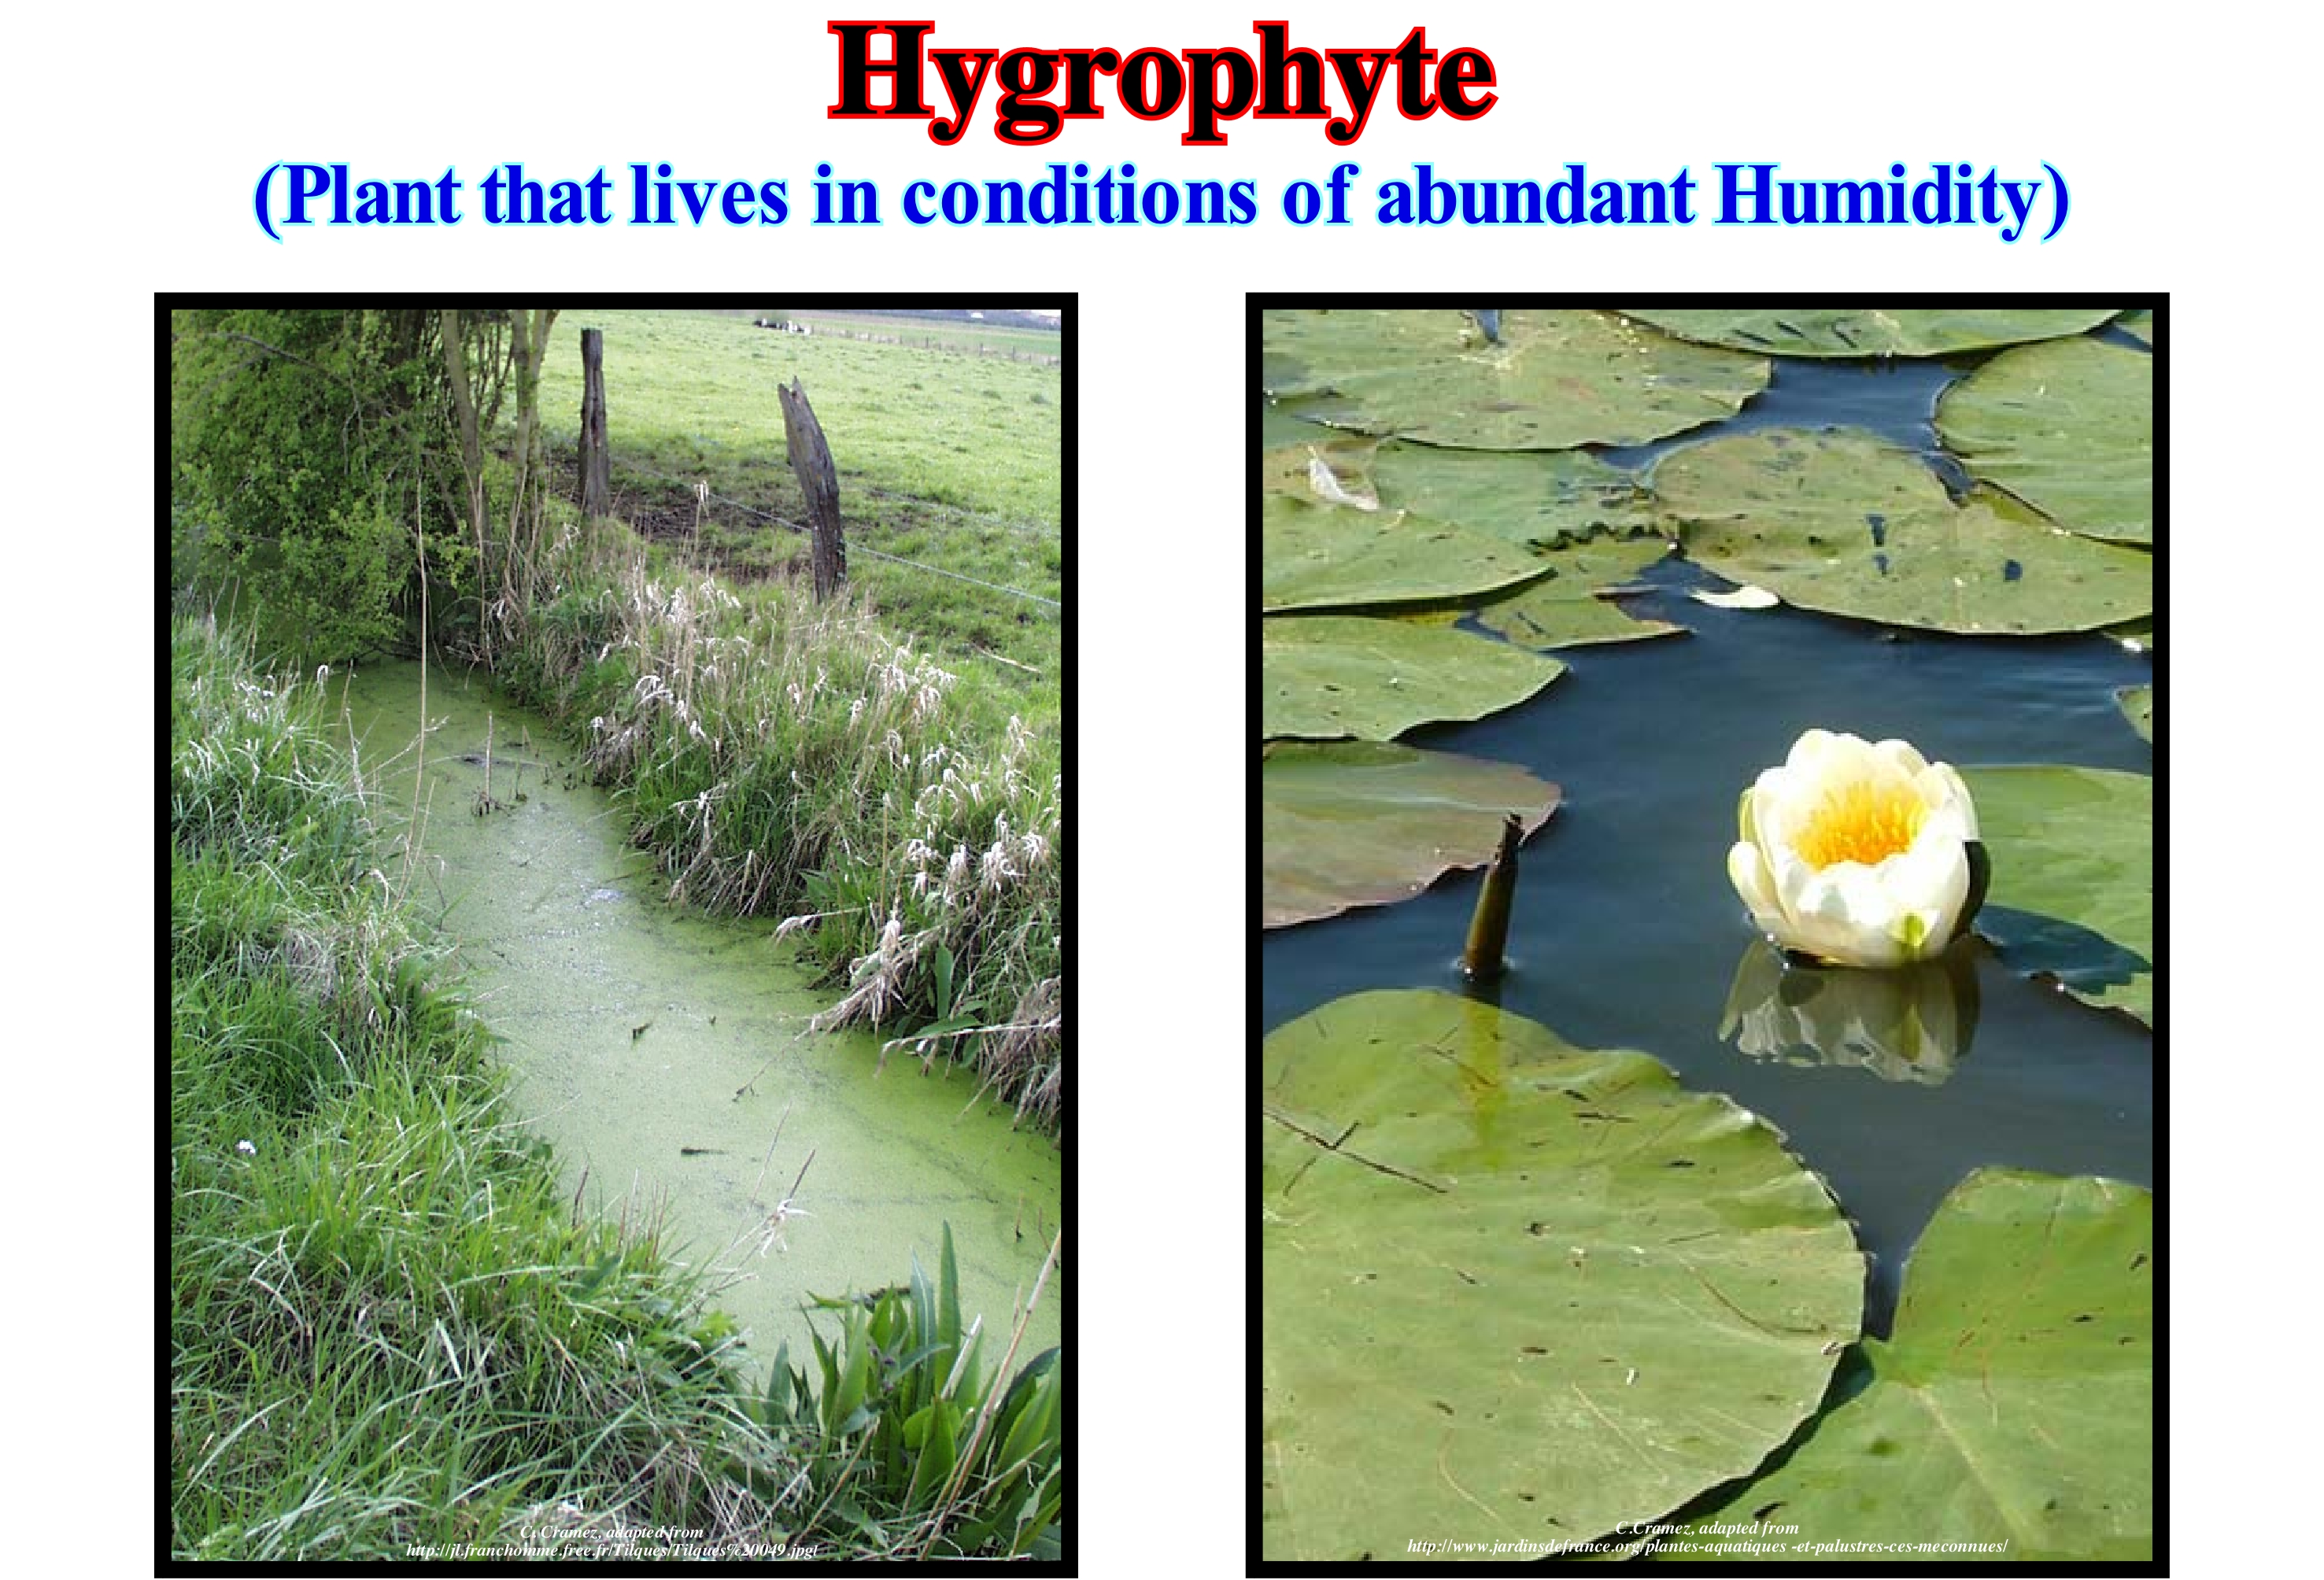
Regarding plants, according to Raunkier's classification, a hygrophyte or hydrophilic plant is a type of plant that lives submerged in water (the buds and leaves are in the water) most of the year or even the whole year. Within this category of plants can be distinguished: (i) Floating hygrophytes, which live on the surface of the water and (ii) Fixed hygrophytes (rooted in the soil) with floating flowers and leaves (such as a water lily) or with leaves such as the elodea (Elodea canadensis). Due to the slow diffusion of the gases in the water, the diffuse light and the relative poverty of salts, the submerged leaves have a very exaggerated surface, in relation to the volume. They can be whole and very thin, divided or fenestrated (full of holes) or small, but very numerous. It is important to note that certain geoscientists differentiate hydrophyte plants from hydrophilic plants, which means that they do not consider these terms as synonyms. For them, hygrophyte plants are those that live in a humid and permanently humid environment with abundant water supply, such as many of the plants that live in the shade or live in the forest. The root and vascular system of these plants are poorly developed. They have perspiration-enhancing structures: large, thin, tender, succulent, and many hydathodes, that is, structures to eliminate, by a droplet process (the loss of liquid water through the surface of the leaves). On the other hand, as light is limited, they often have chloroplasts in the epidermis. Some hygrophyte plants have blue iridescence, which is due to the formation of filters by thin films of interference in the epidermis or chloroplasts. The advantage of these filters in forest shade is, according to some authors, due to a more efficient absorption of the red light waves in detriment of the reflection of the blue light waves. Many tropical forest herbs have anthocyanins (derived from flavylic salts, that is, water-soluble AH-cations, which in nature are associated with sugar molecules) in the abaxial epidermis (which is off the axis of the body), which , apparently increases the absorption of light energy by backscattering light through chlorophyll tissue.
Hygroscopic Water..............................................................................................................................................................Eau hygroscopique
Água higroscópica / Agua higroscópica / Hygroskopische Wasser / 吸湿水 / Гигроскопическая (сконденсировавшаяся) вода / Acqua igroscopica /
Water that forms a thin film around the particles that make up a soil. As the hygroscopic water, it is chemically bound to soil particles. It can not be used by plants. There are three categories of water in a soil: (i) Hygroscopic water ; (ii) Capillary water and (iii) Gravity water.
See: « Juvenile Water »
&
« Formation Water »
&
« Hydrologic Cycle »

Water that is trapped in the space between the sedimentary particles, constitute a soil, can be called unavailable water. It can not be, directly, used by the plants for their feeding. However, this unavailable water can be subdivided into: (i) Hygroscopic water ; (ii) Capillary water and (iii) Gravity water. Hygroscopic water corresponds to the microscopic film of water that surrounds the particles that form a soil. This water is, intimately, bound to soil particles by a strong molecular attraction and therefore can not be displaced naturally. In fact, hygroscopic water is bound to the sedimentary particles by adhesive forces exceeding 31 atm (atmosphere*) and which can, in some cases, exceed 10,000 atm. Capillary water is the water that is retained by cohesive forces between hygroscopic water films. The capillary water fixing pressure is much smaller than the hygroscopic water retention pressure, which means that the capillary water can be displaced by dry air or by the absorption of the plants, but can not be displaced by gravity. The plants use the capillary water through their roots until the capillary force of the soil (force that retains water to the particles that form the soil) is equal to the force of extraction of the roots of the plants. From this moment, the plants can no longer pull the water from the rooting zone and, therefore, wither. Gravity water is water that can be displaced through a soil by the force of gravity. It is the groundwater itself, which, unlike hygroscopic or retention water, can move. Soil water that is not retained or used by plants continues to descend through the ground and integrate groundwater and may force the groundwater to rise. The amount of water retained in a soil, as long as the excess water is drained, is called a soil storage capacity. The amount of water in a soil is controlled by soil texture. Soils mainly composed of clayey particles have much more porosity (total space between sedimentary particles per unit volume) than sandy soil, which means that the storage capacity of a soil increases when the particle size decreases. As can be deduced from the scheme illustrated in this figure, groundwater is all the water that occupies the void spaces of a geological formation. In other words, groundwater is the water present in the aquifers (formation or group of geological formations that can store water, which are usually made up of porous and permeable rocks, capable of holding water and giving it water). Groundwater is formed by surplus rainwater. However, not all water below ground is considered groundwater. Only water below the water table or level ** is considered groundwater.
(*) Pressure unit defined as 101,325 Pa (Pa or Pascal is the pressure that a newton exerts on a square meter that is equal to 100,000 bar). Atmosphere is often used as reference or pressure standard.
(**) Surface that limits the saturated zone of water (zone of saturation) of the sub-saturated zone or zone of aeration.
Hyperbenthos...................................................................................................................................................................................................Hyperbenthos
Hiperbentos / Hiperbentos / Hyperbenthos / Hyperbenthos (底棲生物) / Гипербентос / Iperbenthos /
Small animals that live on the sea floor and that have the ability to swim well and perform, with variations of amplitude, intensity and regularity, seasonal or daily vertical migrations above the seabed.
See: « Benthos »
&
« Hemi-pelagic (organism) »
&
« Animalia (kingdom) »
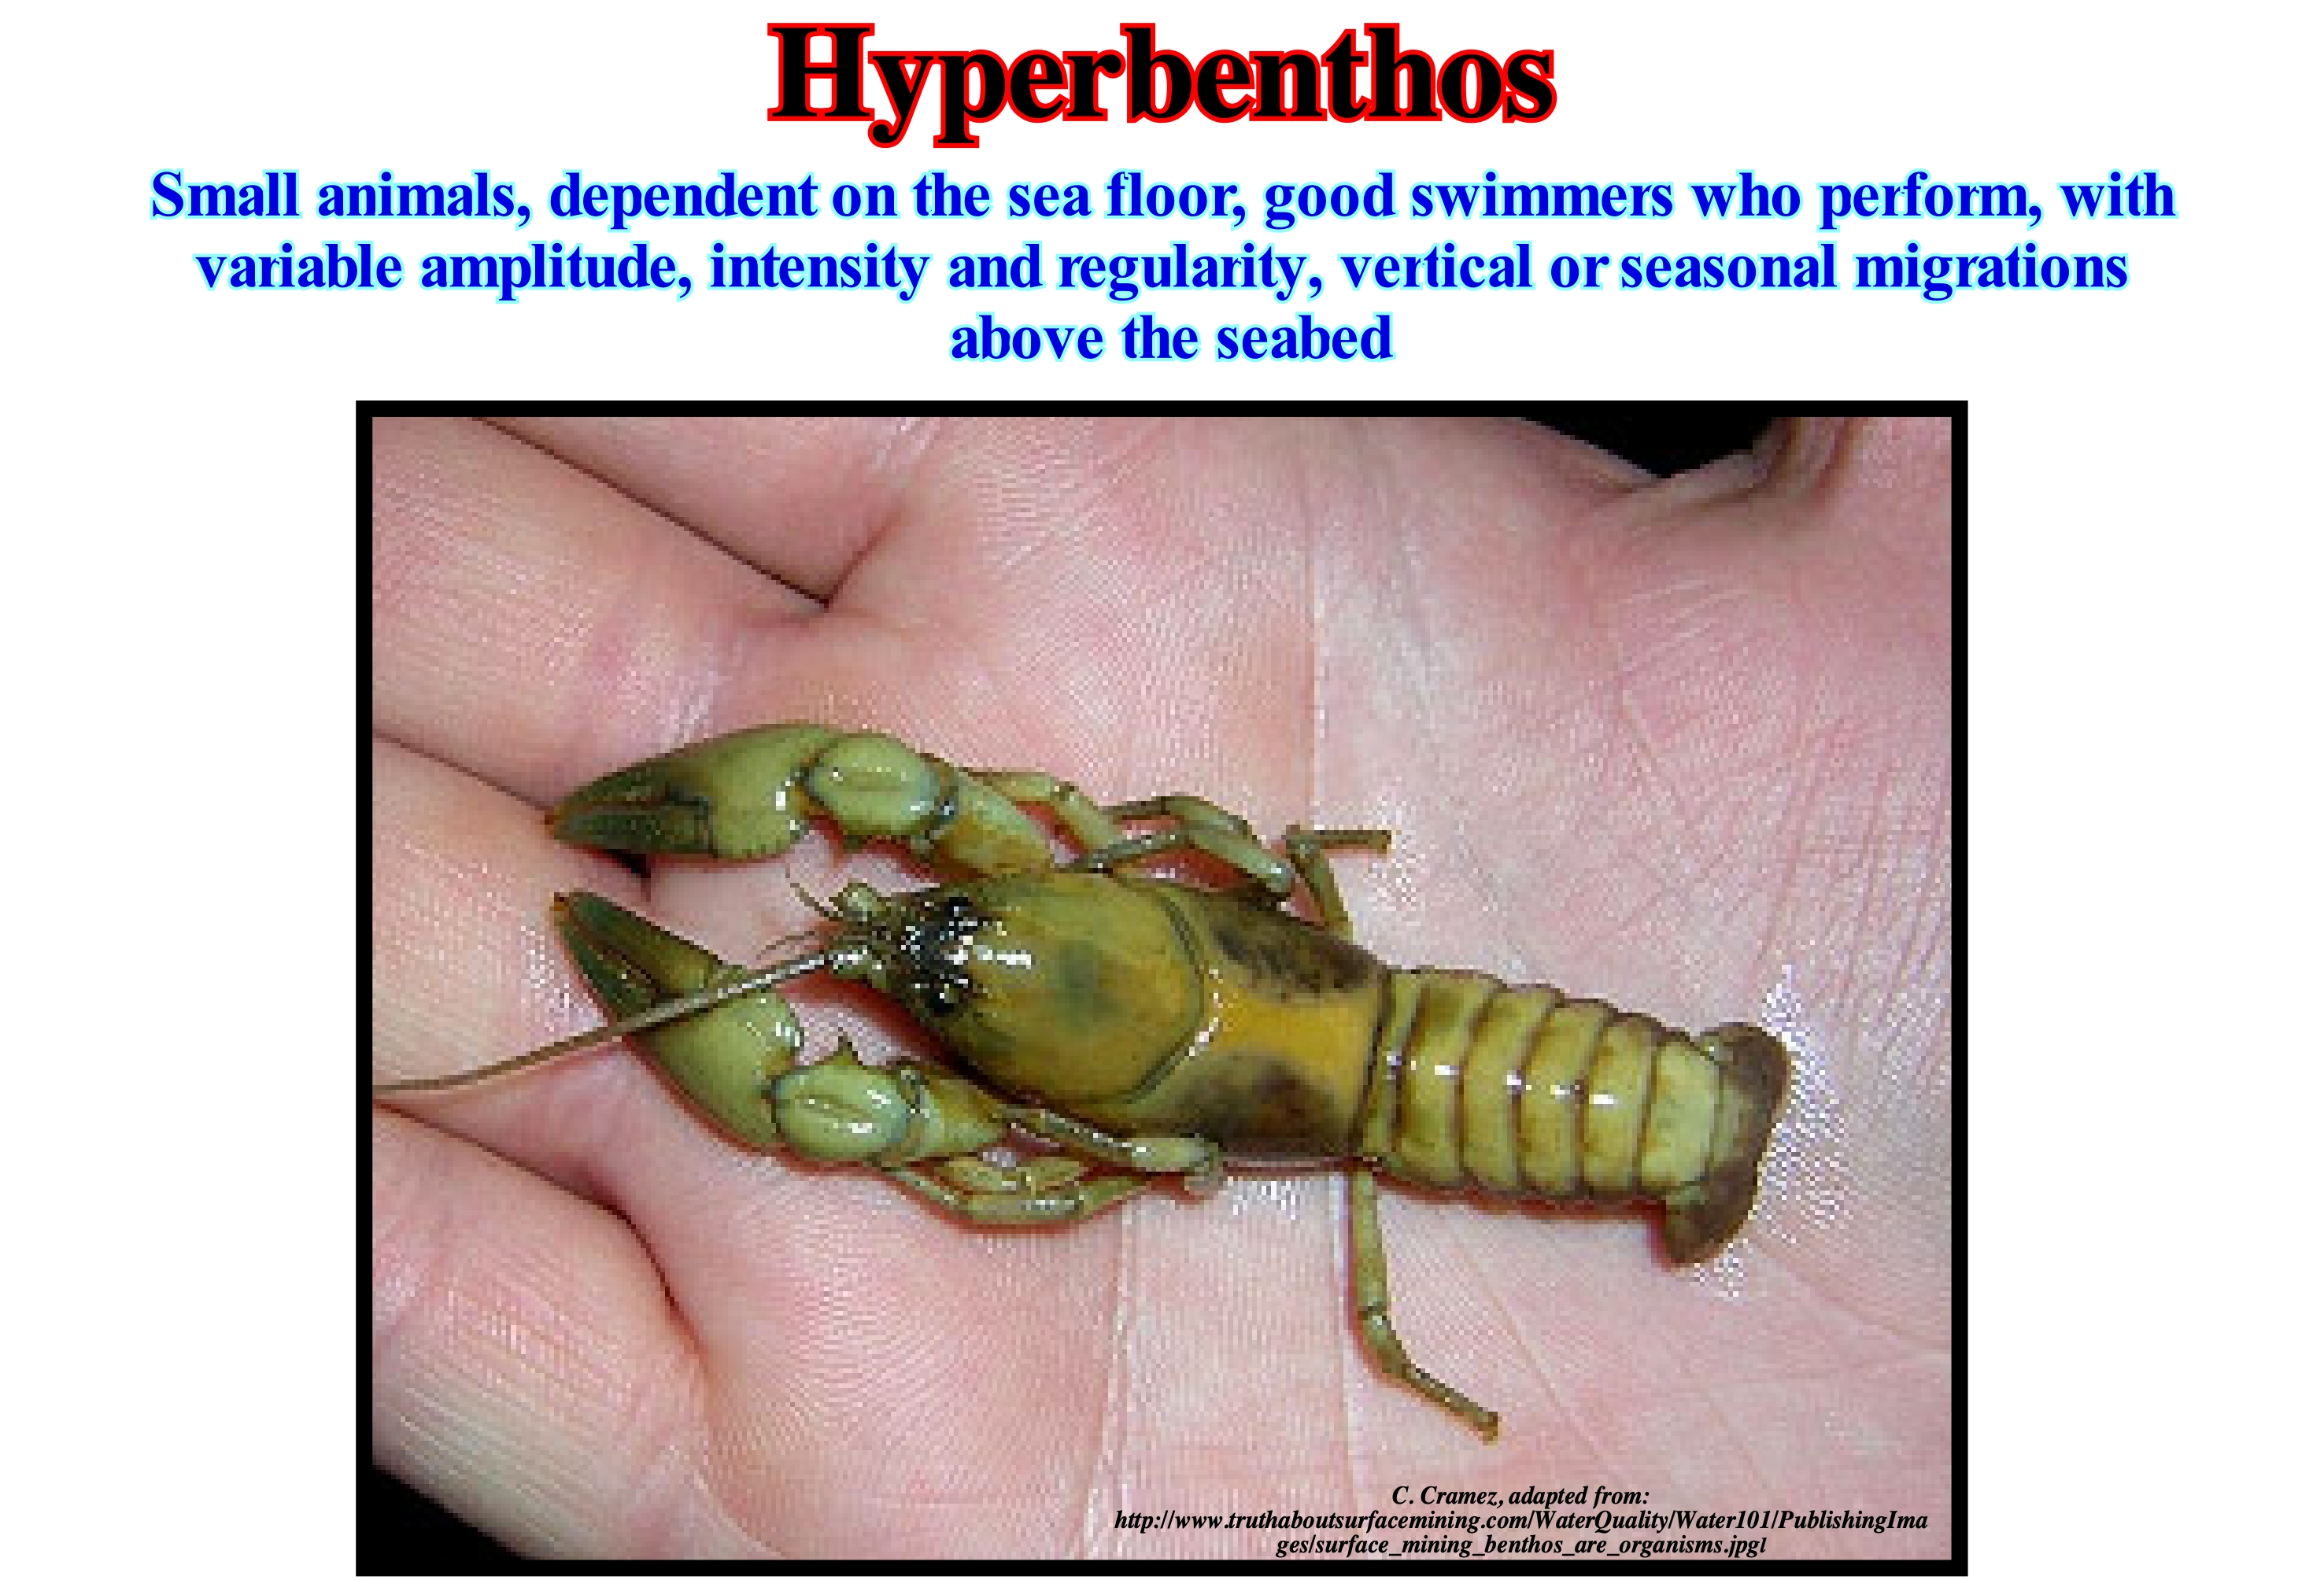
Benthos or benthic organisms live on or near the sea floor. They live in or close to marine sedimentary environments, from intertidal zones to abyssal zones (continental shelf environments included). Regarding the location, benthos are subdivided into: (i) Epi-benthos and (ii) Hyper-benthos (this term is mainly used for crustaceans). The former live on the sea floor or immediately above the sea floor, some are attached to the substrate, while others are mobile. As epi-benthos we can mention the sponges, corals, stars of the sea, etc. The second, that is, the hyper-benthos have a great capacity of swimming that allows them to make vertical migrations, more or less, regular (daily or seasonal) from the bottom of the sea. Recently, some geoscientists distinguish between the really hyper-benthic species and the variety of "visiting" or "immigrant" animals, which can be classified as endobenthos, epibenthos or planktonic. Likewise, the important role of hyperbenthos in the functioning of marine ecosystems was also recognized, especially when it was found that many demersal fish (fish that live most of the time in association with the substrate or in sandy bottoms such as sole, or on rocky bottoms such as grouper) and many epibenthos crustaceans feed on, at least for part of their life, of hyperbenthos animals. At present, there is also a marked interest in the studies of fish larvae and crustaceans that later have a hyperbenthic life stage. As the pelagic/benthos coupling studies associated with energy flows rarely include samples taken a few centimeters above the sea floor, there is a significant underestimation of the flow of organic particles. Very mobile hyperbenthos animals, which live just above the seabed, are^ capture, rarely, d by sampling devices from benthic or pelagic faunas.
Hyperpycnal (Flux)............................................................................................................................................................................................Hyperpycnal
Hiperpicnal / Hiperpicnal (flujo) / Hyperpycnal (Fluss) / Hyperpycnal (流) / Гиперпикнальный поток / Iperpicnal (flusso) /
Water-course that is denser than the body of water into which it enters. When a hyperpycnal current enters a water-body (ocean, lake, etc.), it produces, usually, a turbidity current. The pattern of hyperpicnal flow is that of a planar jet.
See: « Hypo-pycnal (flow) »
&
« Planar Jet »
&
« Axial Jet »
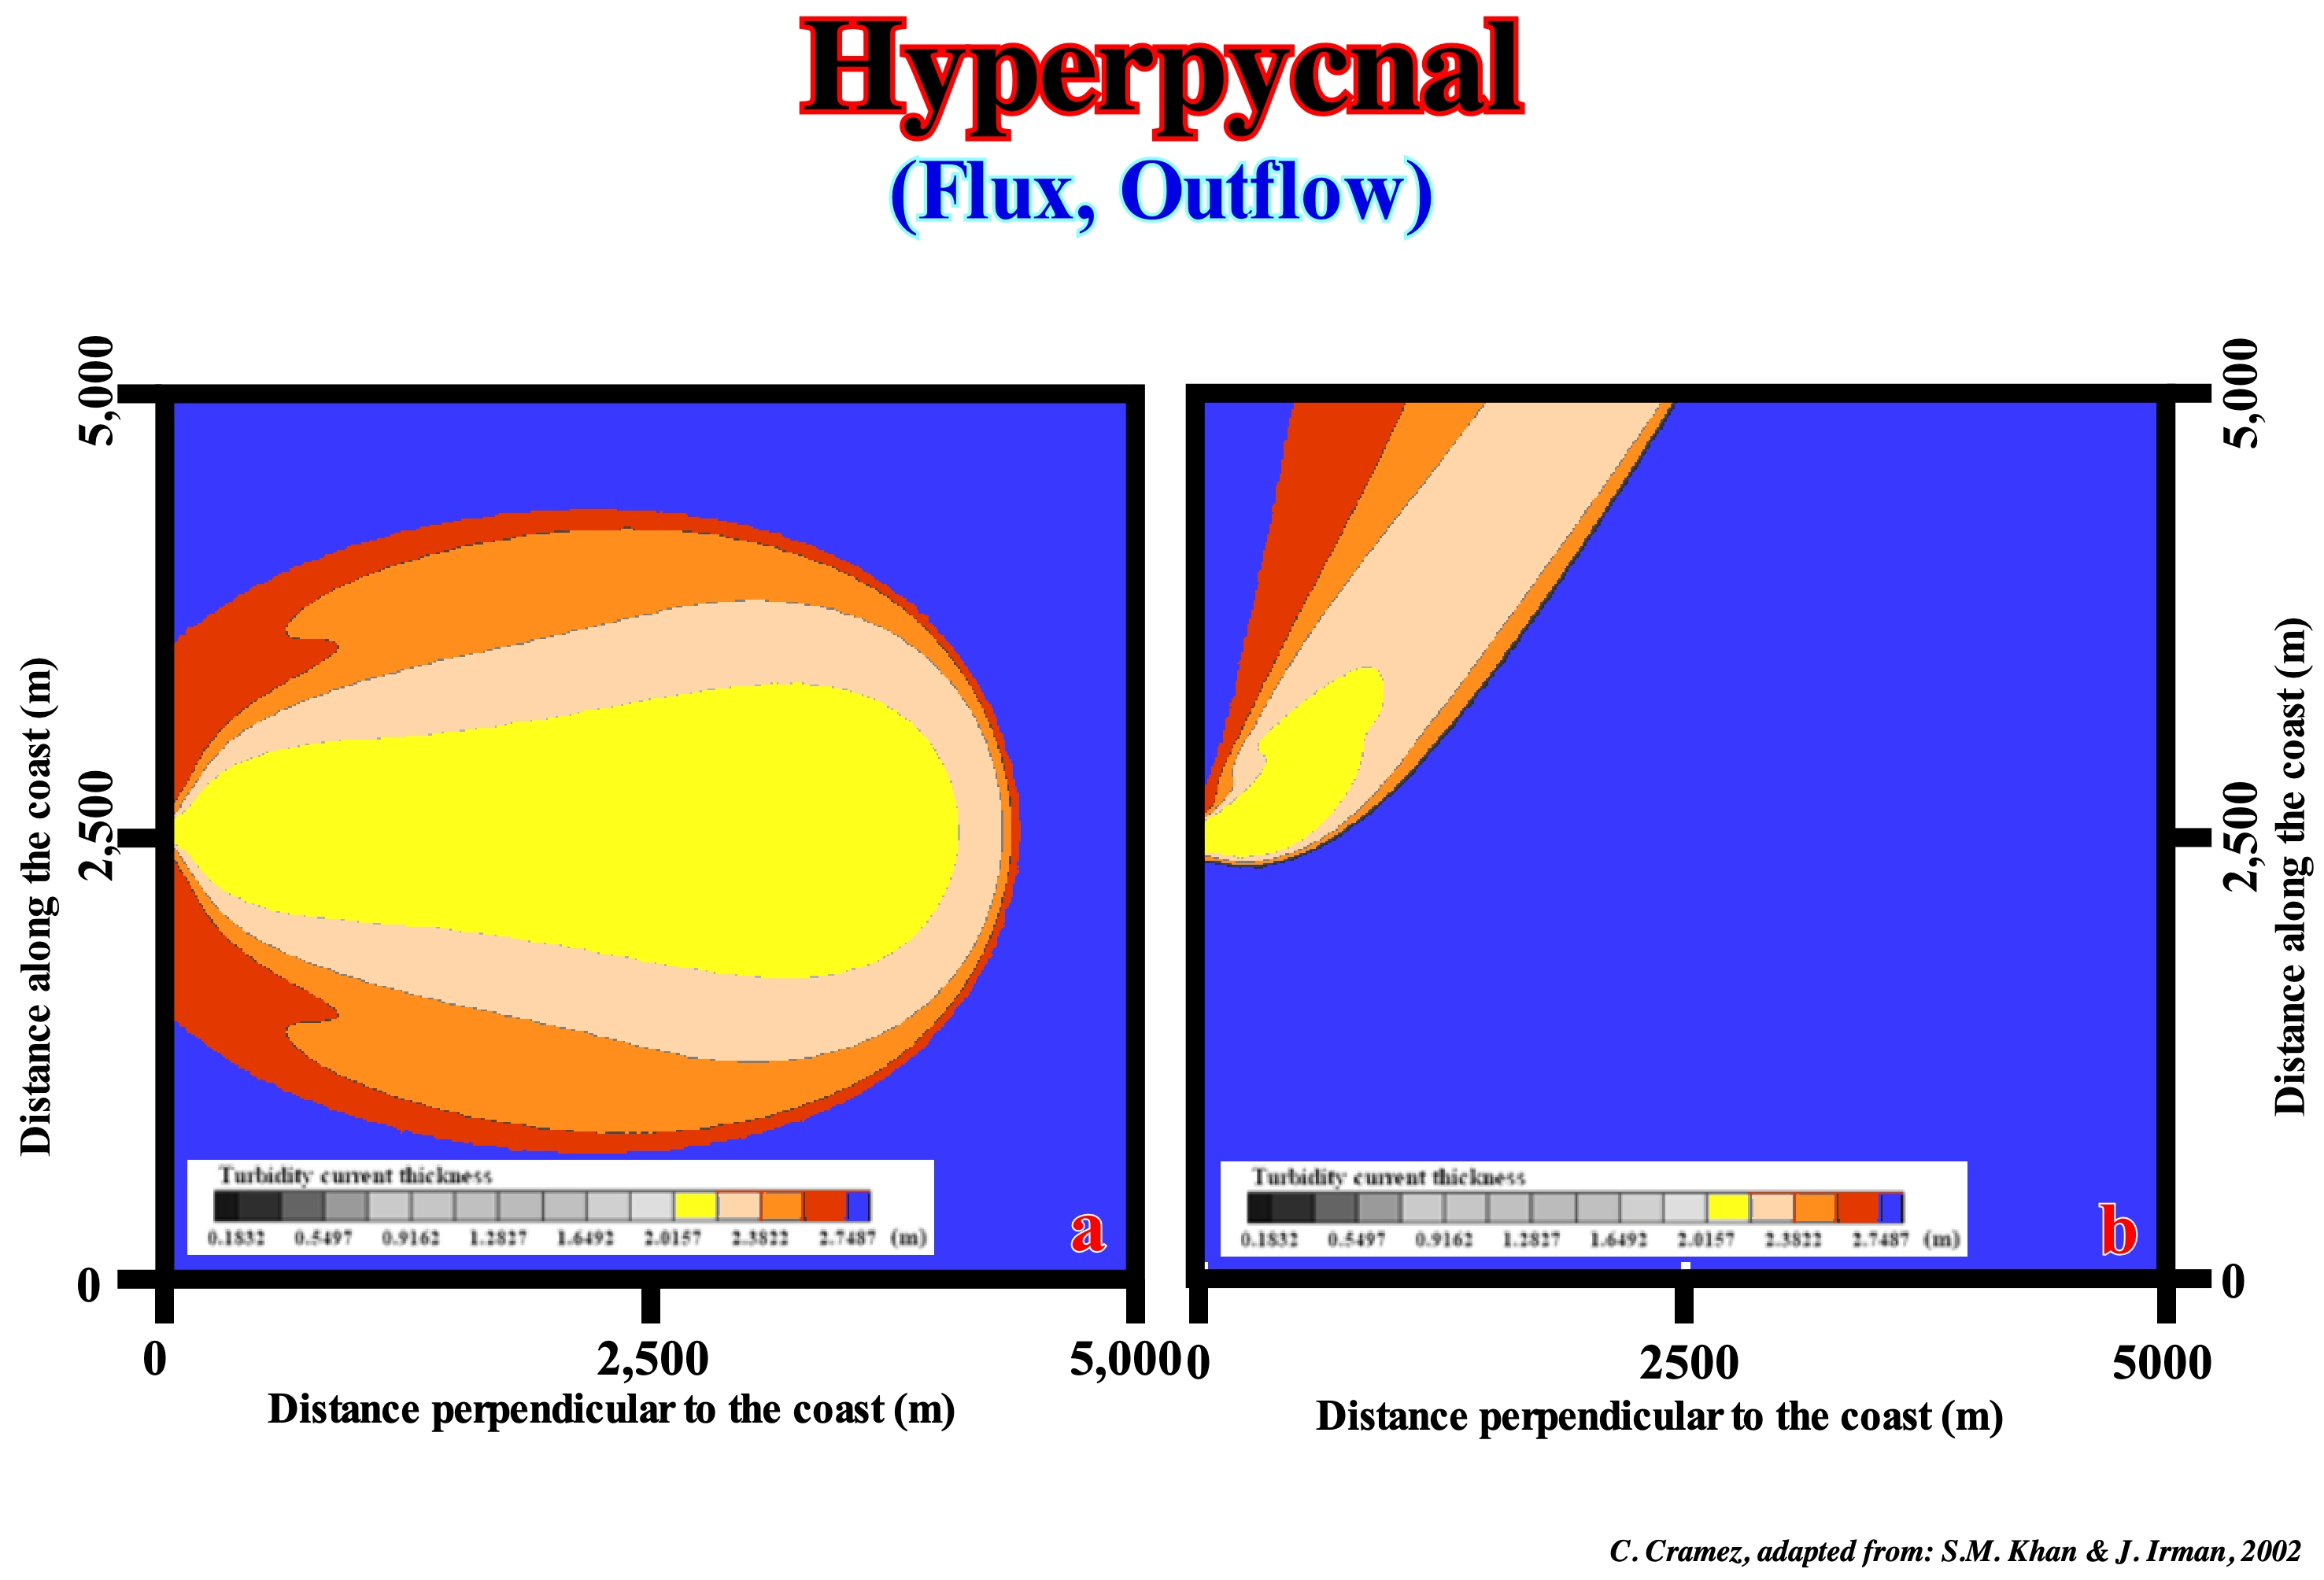
The water fate of a sedimentary particle-laden river is determined by its density relative to the water density of the water body into which it is discharged. Three situations are possible: (i) Hyperpicnal flow, when the water density of the river is greater than the density of the receiving water ; (ii) Hypopycnal Flow, when the water density of the river is smaller than the density of the receiving water and (iii) Homopycnal Flow, when the water density of the river is equal to that of the receiving water. In the first case (hyperpycnal), the water of the river plunges to the bottom of the receiving basin and can form a turbidity current. In the second case (hypopycnal), the sediments spread to the surface of the receiving basin and, gradually, settle to the bottom like a hemipelagite. In the third case (homopycnal), the incoming water mixes with the receiving water and the transported sedimentary particles deposit forming a mouth bar. The most frequent cases are, of course, those of the hyperpycnal and hypopycnal currents. The critical concentration of sediments from which the water of a river is hyperpycnal or hypopycnal can be easily calculated. The density of a stream depends on the fluid density, sedimentary particles, and clasts* concentration it carries. The density of sea-water depends on salinity and temperature. The critical concentration of sediments for a current to become hyperpycnal, for example, depends on the climate and ocean circulation pattern at the time of deposition. In this figure is shown a simulation of the entrance of a hyperpycnal current in the Adriatic Sea (Potenza River). In the left scheme, the authors assumed that there was no littoral current parallel to the coastline. On the right, they admitted the presence of a coastal current parallel to the coast line of 50 cm/s, which, of course, interacted with the hyperpycnal stream. The duration of this simulation was 4 hours. It is possible that many turbidity currents responsible for the deposition of deep submarine fans have formed under these conditions.
(*) Clasts are sedimentary particles as , silt, sand, gravel, etc., especially as a constituent fragment of a clastic rock formation, as distinguished from a chemical or biogenic component of such a formation.
Hypocentre.......................................................................................................................................................................................................................Hypocentre
Hipocentro / Hipocentro / Hypozentrums / 震源 / Гипоцентр / Ipocentro /
Focus of a earthquake or a nuclear explosion.
See: « Tsunami »
&
« Epicenter »
&
« Fault »
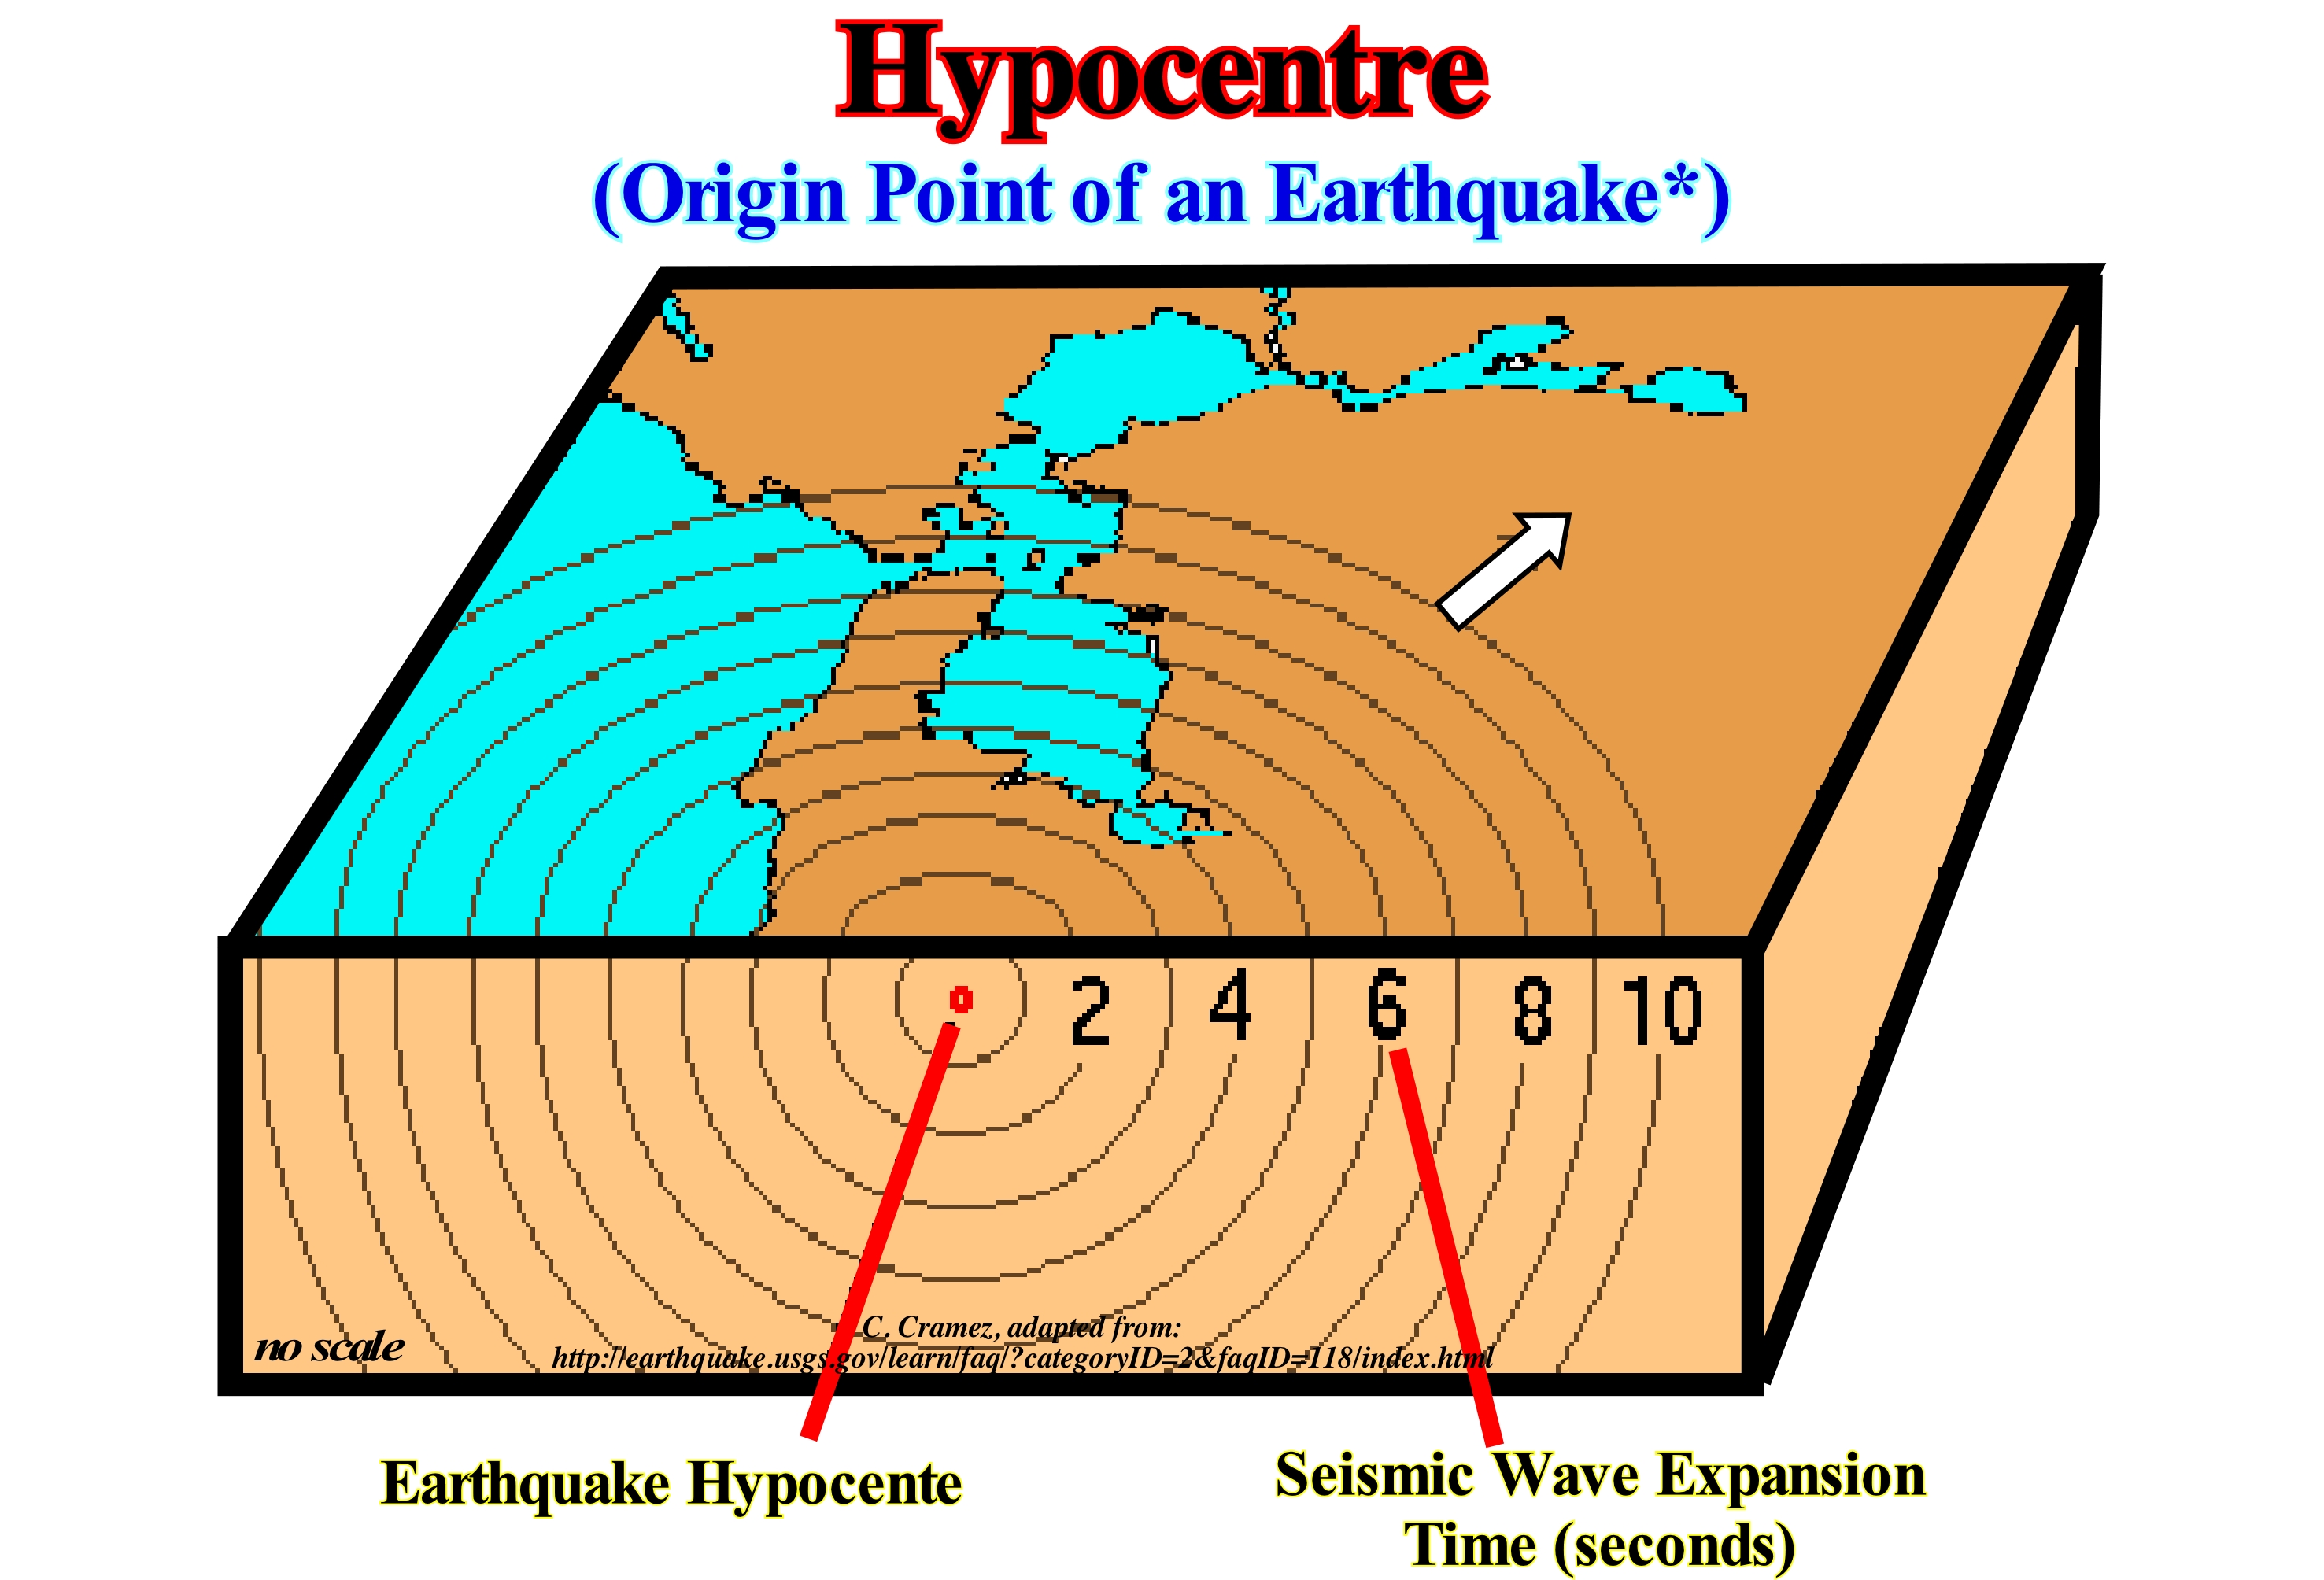
In relation to an earthquake, the hypocenter is the focus of the earthquake, while in relation to a nuclear explosion, the hypocenter is the zero surface point. This means that the hypocenter of an earthquake is the position where the deformation energy stored in the rocks is released for the first time. It marks the point where the fault begins to form, which occurs at the focal depth below the epicentre (the point on the Earth's surface that is directly above the hypocenter or focus, that is, the point where an earthquake or a underground explosion originates). The focal depth can be calculated from measurements based on the propagation of seismic waves. As in all wave phenomena, there is a certain uncertainty in the measurements, which increases with the wave-length. Therefore, the focal depth of the source of the wave-length (low frequency) waves is difficult to determine accurately. Very strong earthquakes radiate a large fraction of the energy released in seismic waves with very large wave-lengths, so a strong earthquake involves the release of energy from a large rock mass. An earthquake is the result of a sudden release of energy in the Earth crust that creates seismic waves. The seismicity or seismic activity of an area refers to the frequency, type and size of earthquakes that the area experienced over a significant period of time (geological time). The amplitude of the earthquakes is measured with seismographs, i.e., devices that record the seismic waves. The magnitude of an earthquake is, conventionally, considered from 3, since earthquakes with lower magnitude are almost always imperceptible, while those of magnitude 7, or more, cause great damage in large areas. The intensity of the motion produced by an earthquake is measured on a modified Mercalli scale: (1) Imperceptible ; (2) Very weak ; (3) Poor ; (4) Moderate ; (5) Strong ; (6) Pretty strong ; (7) Very strong ; (8) Ruinous ; (9) Disastrous ; (10) Destroyer ; (11) Catastrophic and (12) Cataclysm. The latter characterized by displacements of large rock masses, distorted topography, objects thrown into the air, was never recorded in the historical period.
(*) A sudden and violent shaking of the ground, sometimes causing great destruction, as a result of movements within the earth's crust or volcanic action.
Hypogenic Water (Juvenile water)...............................................................................................................................Eau hypogénique
Água hipogénica / Agua hipogénica / Juveniles Wasser / 少年水 / Ювенильная вода / Acqua giovanile /
Water derived, directly, from a magma and which can be, generally, regarded as a water that first comes to the Earth's surface. Synonym with Juvenile Water.
See: « Juvenile Water »
&
« Formation Water »
&
« B-Type Subduction (Benioff) »
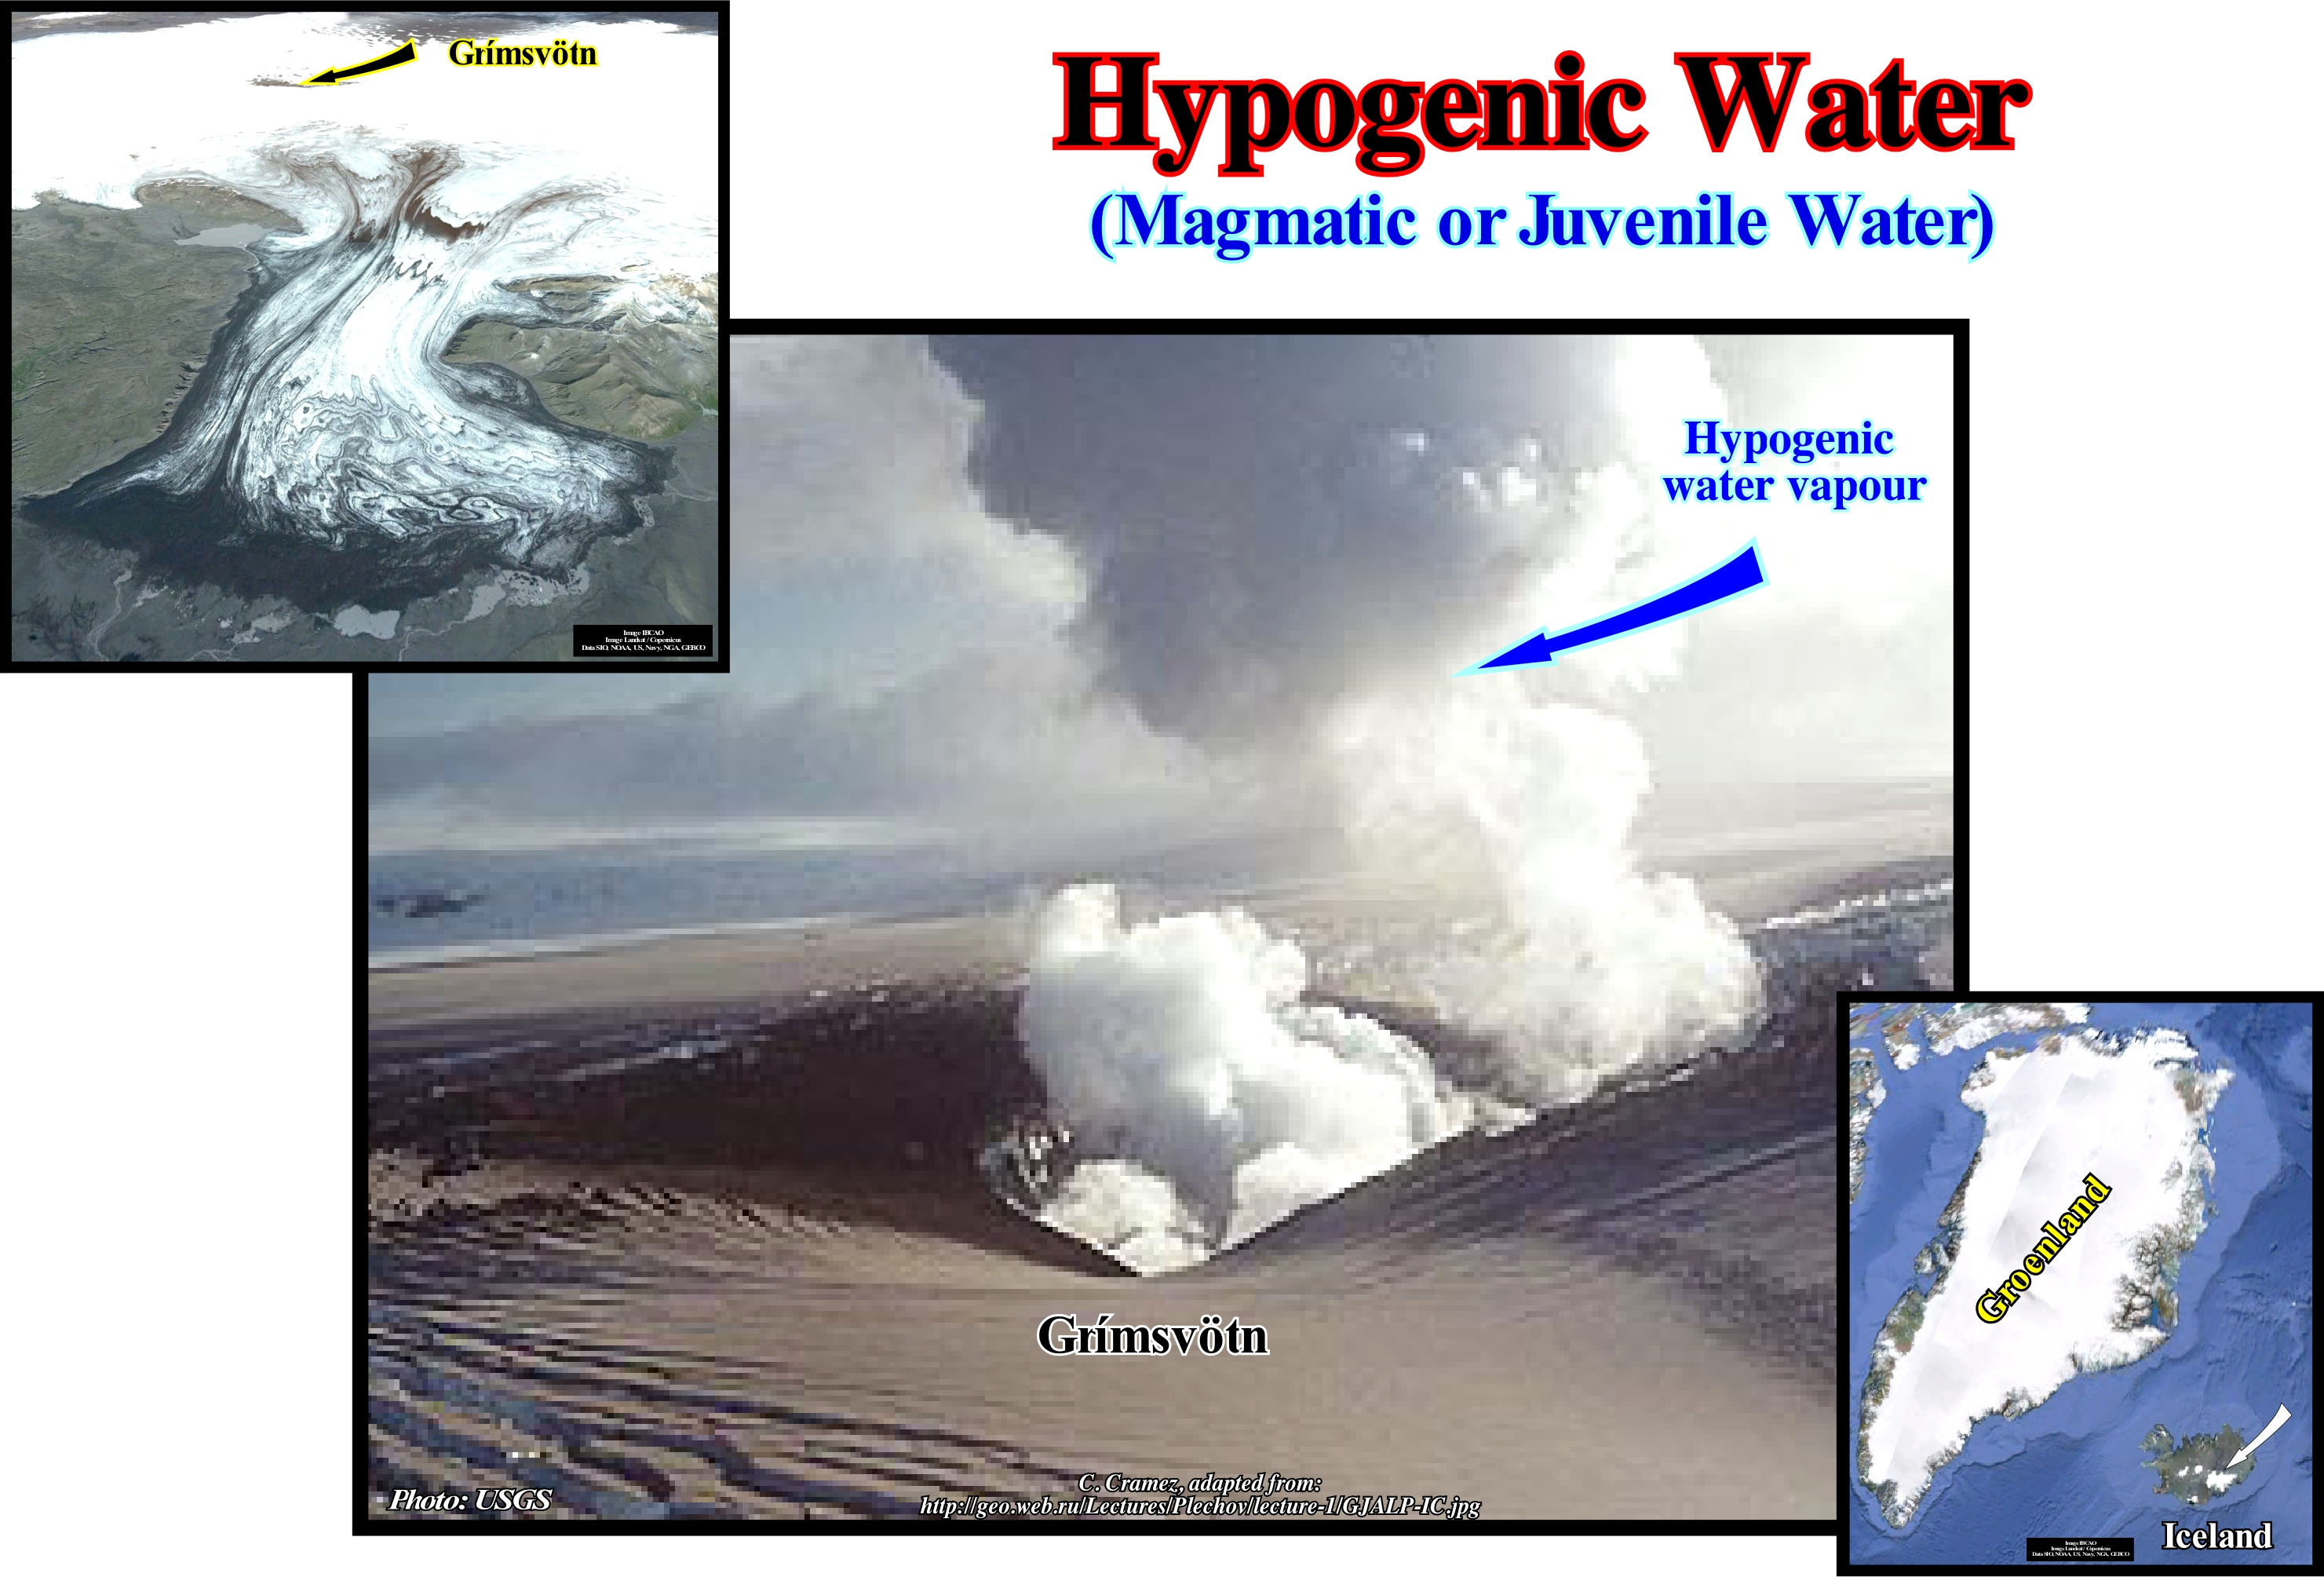
Hypogenic or juvenile water, in the form of vapour, is almost always associated with volcanic eruptions, as witnessed by this photograph of the eruption along the lakes' fissures of Grímsvötn (Iceland) in 1998. Sometimes, water is very likely to come to the Earth's surface for the first time. This is certainly true when hypogenic or juvenile water is associated with hot spots in the asthenosphere. At present, i.e., after 4.5 Gy (billions of years) of geological history, the most likely is that water is recycled in the same way as rocks are, that is, that water has already made part of the composition of the Earth's surface. Subduction zones, whether B-type (Benioff) or A-type (Ampferer), strongly, suggest a superficial origin of the hypogenic water. Most of the geoscientists now admit that: (i) All Paleozoic oceanic crusts were consumed in the subduction zones (except for the very small fraction that forms the Paleozoic Ophiolites) and (ii) In the post-Pangea oceanic crust, the larger part, in particular, formed during the Triassic and Jurassic, has also disappeared along the B-type subduction zones (a small amount of this ancient oceanic crust is found in the Meso-Cenozoic mountain belts in the form of Mesozoic ophiolites). All this means that in the B-type subduction zones the descending lithospheric plates (oceanic crust and deep pelagic sediments that are rich in water) carry the water to the deeper parts of the subduction zone where it is swallowed and assimilated by the asthenosphere, at the same time, as new magmas form**. The continuation of this geological history is well known to all geoscientists and especially to people living near the volcanic arcs of the lithospheric plates. The magma, thus formed, rise to the Earth's surface through the riding plate, most often, catastrophically, where they form a whole series of effusive rocks, at the same time releasing a large part of the water they contain. It is this water, which the vast majority of geoscientists call hypogenic or juvenile water.
(*) Upper zone of the terrestrial mantle, under the lithosphere, more or less between 30-130 km and 670 km of depth, consisting of ductile silicates in the solid state but, locally, partially or totally partially melted, depending on the location and depth of the magma chambers, on which the lithospheric plates move, which allows the isostatic adjustments.
(**) The term magma is used in geology to refer to the masses of rock in total or partial melting and the associated volatile materials that exist beneath the surface of the earth. The mass rocks are mainly composed of silicates (silicon and oxygen compounds may be accompanied by aluminum, iron, magnesium or calcium) at high pressure and temperature. Volatile material is rich in metal ions (atoms or molecules that acquire or lose electrical charge by the gain or loss of electrons) and sulfur which may contain suspended crystals, dissolved gases and sometimes gas bubbles.
Hypopycnal (Flux)...................................................................................................................................................................................................Hypopycnal
Hipopicnal / Hipopicnal (flujo) / Hypopycnal (Fluss) / Hypopycnal (流) / Гипопикнальный поток / Ipopicnal (flusso) /
Flow of water that is less dense than that of the water-body into which it enters (receiving basin). Upon entering a receiving basin, the sedimentary particles carrying by a hypopycnal stream are dispersed on the surface of the basin, and are later deposited in the bottom of the basin, forming hemipelagic (deep deposit in which more than 25% of the fraction of the particles has a size greater than 5 micrometers). The flow pattern is that of an axial jet.
See: « Hyperpycnal (flow) »
&
« Planar Jet »
&
« Axial Jet »
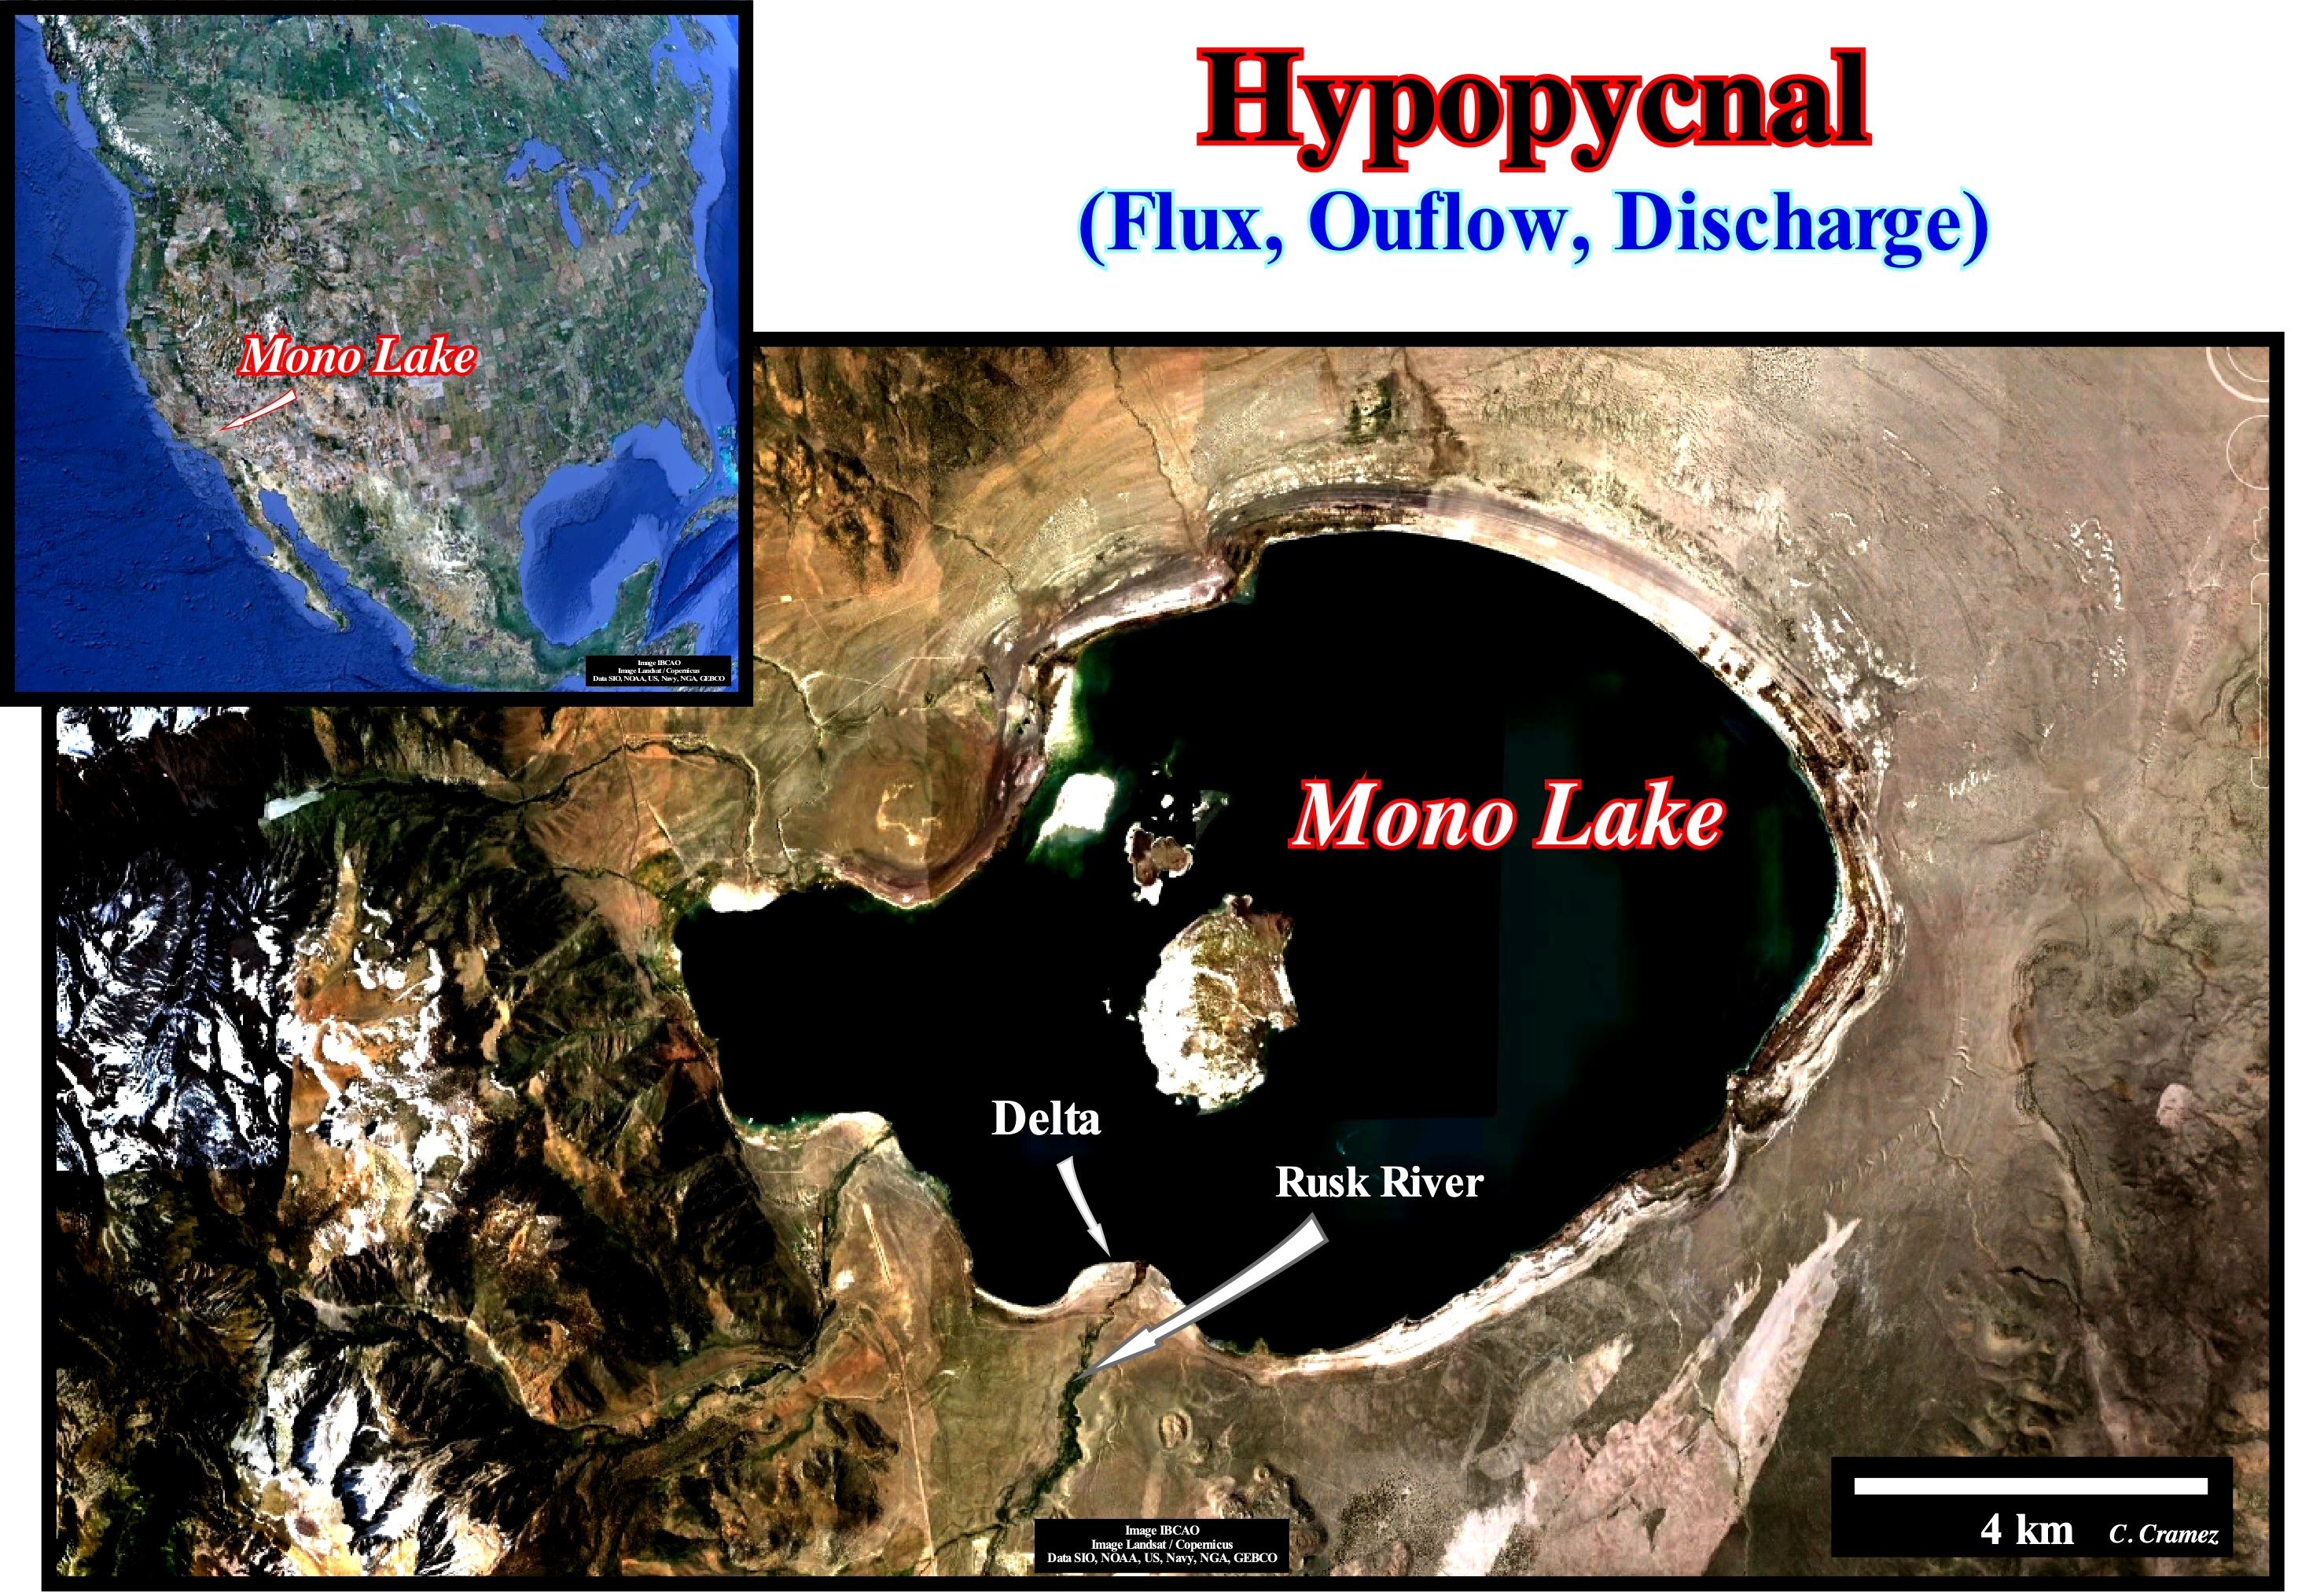
When water from a sedimentary particle-laden water-course enters another water-body (receiving basin), three things can happen: (i) The water density of the water-course may be greater than the density of the receiving water (hyperpycnal flow) ; (ii) The density of the water-course is equal to that of the receiving water (homopycnal flow) and (iii) The density of the river water is smaller than the density of the receiving water (hypopycnal flow). When the flow is hypopycnal, the sediments spread to the surface of the receiving basin and gradually deposit to the bottom forming a hemipelagite* . A hypopycnal runoff is created when a little dense water-courser enters a body of high-density water. Under these conditions, the water-course, when it enters the receiving basin, flows outwards depositing, gradually, the clay fractions which it carries in suspension, eventually, forming a prodelta. The clay particles are no longer suspended by flocculation, i.e., by the agglutination of the particles due to the creation of negatively and positively charged particles by seawater. In homo-pycnal condition, three types of jets can exist in front of a distributary channel: (1) Axial Jet, without friction with the bottom of the body of receiving water ; (2) Planar Jet, flow with great velocity entering a shallow basin, suffering friction with the bottom of the body of receiving water ; (3) Floating plume, the supplied water generates plumes (however, at the beginning, at the entrance to the receiving basin, the flow is governed by gravitational forces, which may suggest a more jets-like behaviour). Note that plumes are flows with buoyancy fed continuously, whereas the jets are flows with the amount of movement, continuously, fed by the source (Crapper, 1977). The amount of movement in the jets remains constant along the central flow lines in any cross section, while in the plumes there is a gradual increase, while maintaining constant buoyancy. Both streams expand laterally through the receiving basin. The difference between a jet and a plume has nothing to do with the turbulence**. In general, Poiseuille's law theoretically indicates the relationship between the flow rate and the viscosity of the fluid, the pressure difference at the ends of a channel, the length and radius of the channel. This ratio is verified, experimentally, in small radius channels and is often used in viscometers because it says, in particular, that the flow is inversely proportional to viscosity (https://fr.wikipedia.org/wiki/Ecoulement_de_Poiseuille). Both can have a turbulent or laminar behaviour. This photograph illustrates the mouth of the River Rusk in Mono Lake which functions as a reception basin. The river current is hypo-pycnal, which means that the water density of Mono Lake is greater than the water density of the Rusk River. Thus, when the river valley is flooded by the rising of the lake level, the fresh water of the river, as it enters the lake, floats on the water of the lake which makes the delta area very productive from the ecological point of view. In this photograph the delta building constructed by the waters of the river Rusk is perfectly visible. Do not confuse deltaic building with delta. The thickness of a delta seldom exceeds 30-6 meters, while the thickness of a deltaic building, which more or less the vertical stacking of many deltas, can reach thousands of meters.
(*) For Bates & Jackson (1987), a hemipelagic sediment is a deep water sediment that contains a small amount of terrigeneous material and pelagic remains. The genesis of hemipelagic sediments is often associated with redeposition processes and includes finer pelitic material from the turbidite streams that spread on the abyssal plain near the continental foothills. Hemi-pelagic deposits are, in fact, impure pelagic deposits. Yes, it is always useful to specify in what sense the term hemi-pelagic is used. Unlike the hemi-pelagic sediments, the pelagic ones are deposited in the abyssal plain at a great distance from the continents, that is, away from the gross terrigeneous contributions and turbidity currents, from which the submarine cones of slope and the submarine cones of basin (relatively close to the continents, since the sediments that compose them are of terrigeneous origin).
(**) Deep-sea mud deposit in which more than 25% of the fraction of the particles are coarser that 5 microns, whose origin is terrigeneous, volcanic or neritic.
(***) Flow of a fluid in which the particles transported by the fluid mix nonlinearly, that is, in a chaotic way with great agitation and swirls, in opposition to laminar flow, in which Poiseuille's law does not apply.
Hypothetical Petroleum System (.).......................................Système pétrolier hypothétique (.)
Sistema petrolífero hipotético (.) / Sistema petrolífero hipotético (.) / Hypothetische Erdöl-System (.) / 假设石油系统(.) / Гипотетическая нефтегазоносная система (.) / Petrolio sistema ipotetico (.) /
When there is a correlation between the source-rock and the hydrocarbons, but not yet corroborated by biomarkers.
See: « Oil-Pool »
&
« Source-Rock »
&
« Reservoir-Rock »
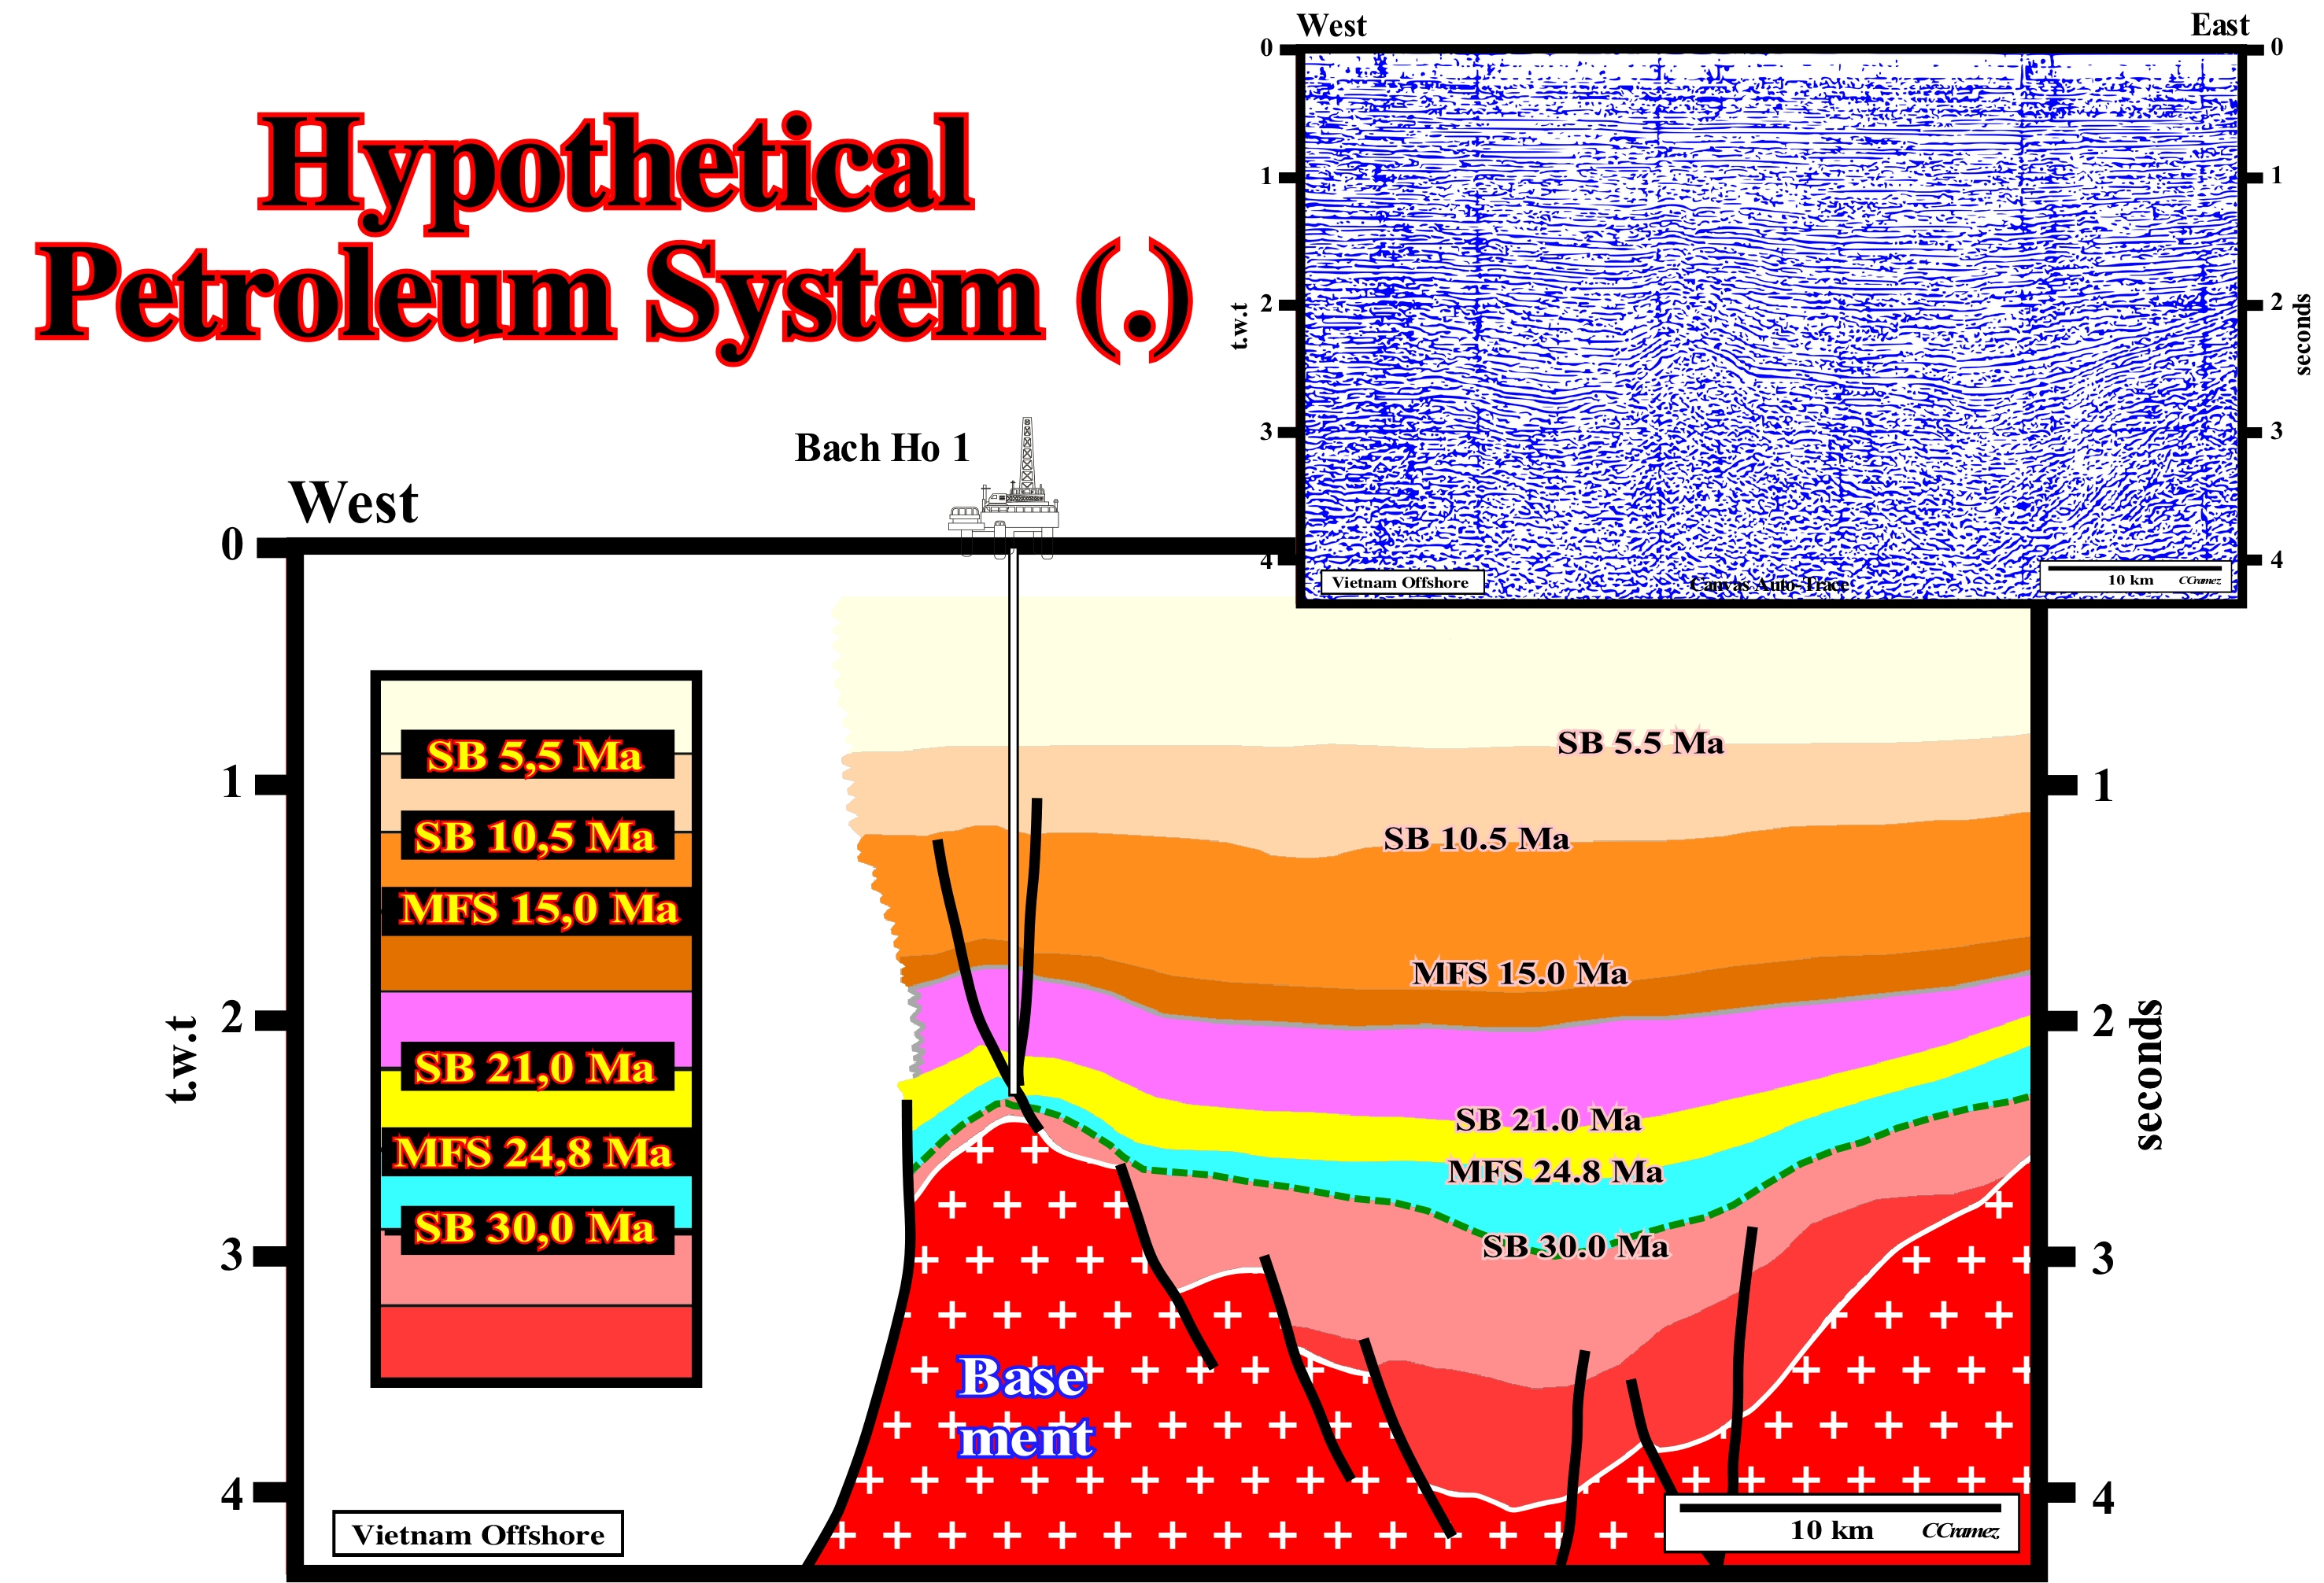
This tentative geological interpretation of a Canvas auto-trace of a Vietnam offshore seismic line illustrates a hypothetical petroleum system (.), since an economic accumulation of oil was found in the Bach Ho ≠ 1 well. On the other hand, lacustrine rocks rich in matter organic matter are known in the half-grabens of the rift phase of the back-arc basin of Vietnam offshore. However, as the proof that these source-rocks generated the hydrocarbons have not yet been made (it is very possible that, at present, it has already been done), the petroleum system should be, provisionally, considered as hypothetical. Do not forget that Magoon, in 1987, considered three types of petroleum systems as a function of the degree of certainty: (1) Known Petroleum System (!) ; (2) Hypothetical Petroleum System (.) and (3) Speculative Petroleum System (?). In a known petroleum system (!), the correlation between the source-rock and hydrocarbons is known, in particular by biomarkers (in the case of petroleum). In a hypothetical petroleum system (.), there is no correlation between source-rock and the found hydrocarbons. A speculative Petroleum System (?), is based, just, on geological or geophysical data, which still have not been tested by the exploration operations. This classification is, also, based on the fact that an petroleum system has three important temporal aspects: (A) Age ; (B) Critical Moment and (C) Preservation Time. The preservation time of a petroleum system begins, immediately after the process of generation-migration-accumulation occurs and extends to today. During the preservation time, re-migration, physical or biological degradation or a complete destruction of the oil may occur. During the preservation time, a re-migration of the oil may accumulate in reservoir-rocks after the petroleum system has formed. If insignificant tectonic activity occurs during the preservation time, the accumulations, generally, remain in their original position. A remigration takes place during the preservation time only if folding, uplift, fracturing or erosion occurs. If all the accumulations are destroyed during the preservation time, the evidence of existence of the petroleum system disappears. An incomplete or just completed petroleum system lacks preservation time.
(*) The phase of a petroleum system after hydrocarbons accumulate in a trap and are subject to degradation, re-migration, tectonism or other unfavourable or destructive processes (https://www.glossary.oilfield.slb.com/en/Terms/p/preservation.aspx).
Hypsometric (Curve)....................................................................................................................Hypsométrique, Hypsographique
Hipsométrica / Hipsométrica / hypsometrischen Kurve / 分层设曲线 / Гипсометрическая кривая / Curva ipsometrica /
Curve representing the areal distribution of relief altitudes of the Earth's surface. When this areal distribution includes the depths of the submarine relief, the curve or the chart is hypsobathimetric. Synonym for Hypsometric Curve.
See: « Hypsometric Profile »
&
« Physiographic (province) »
&
« Contour Map »
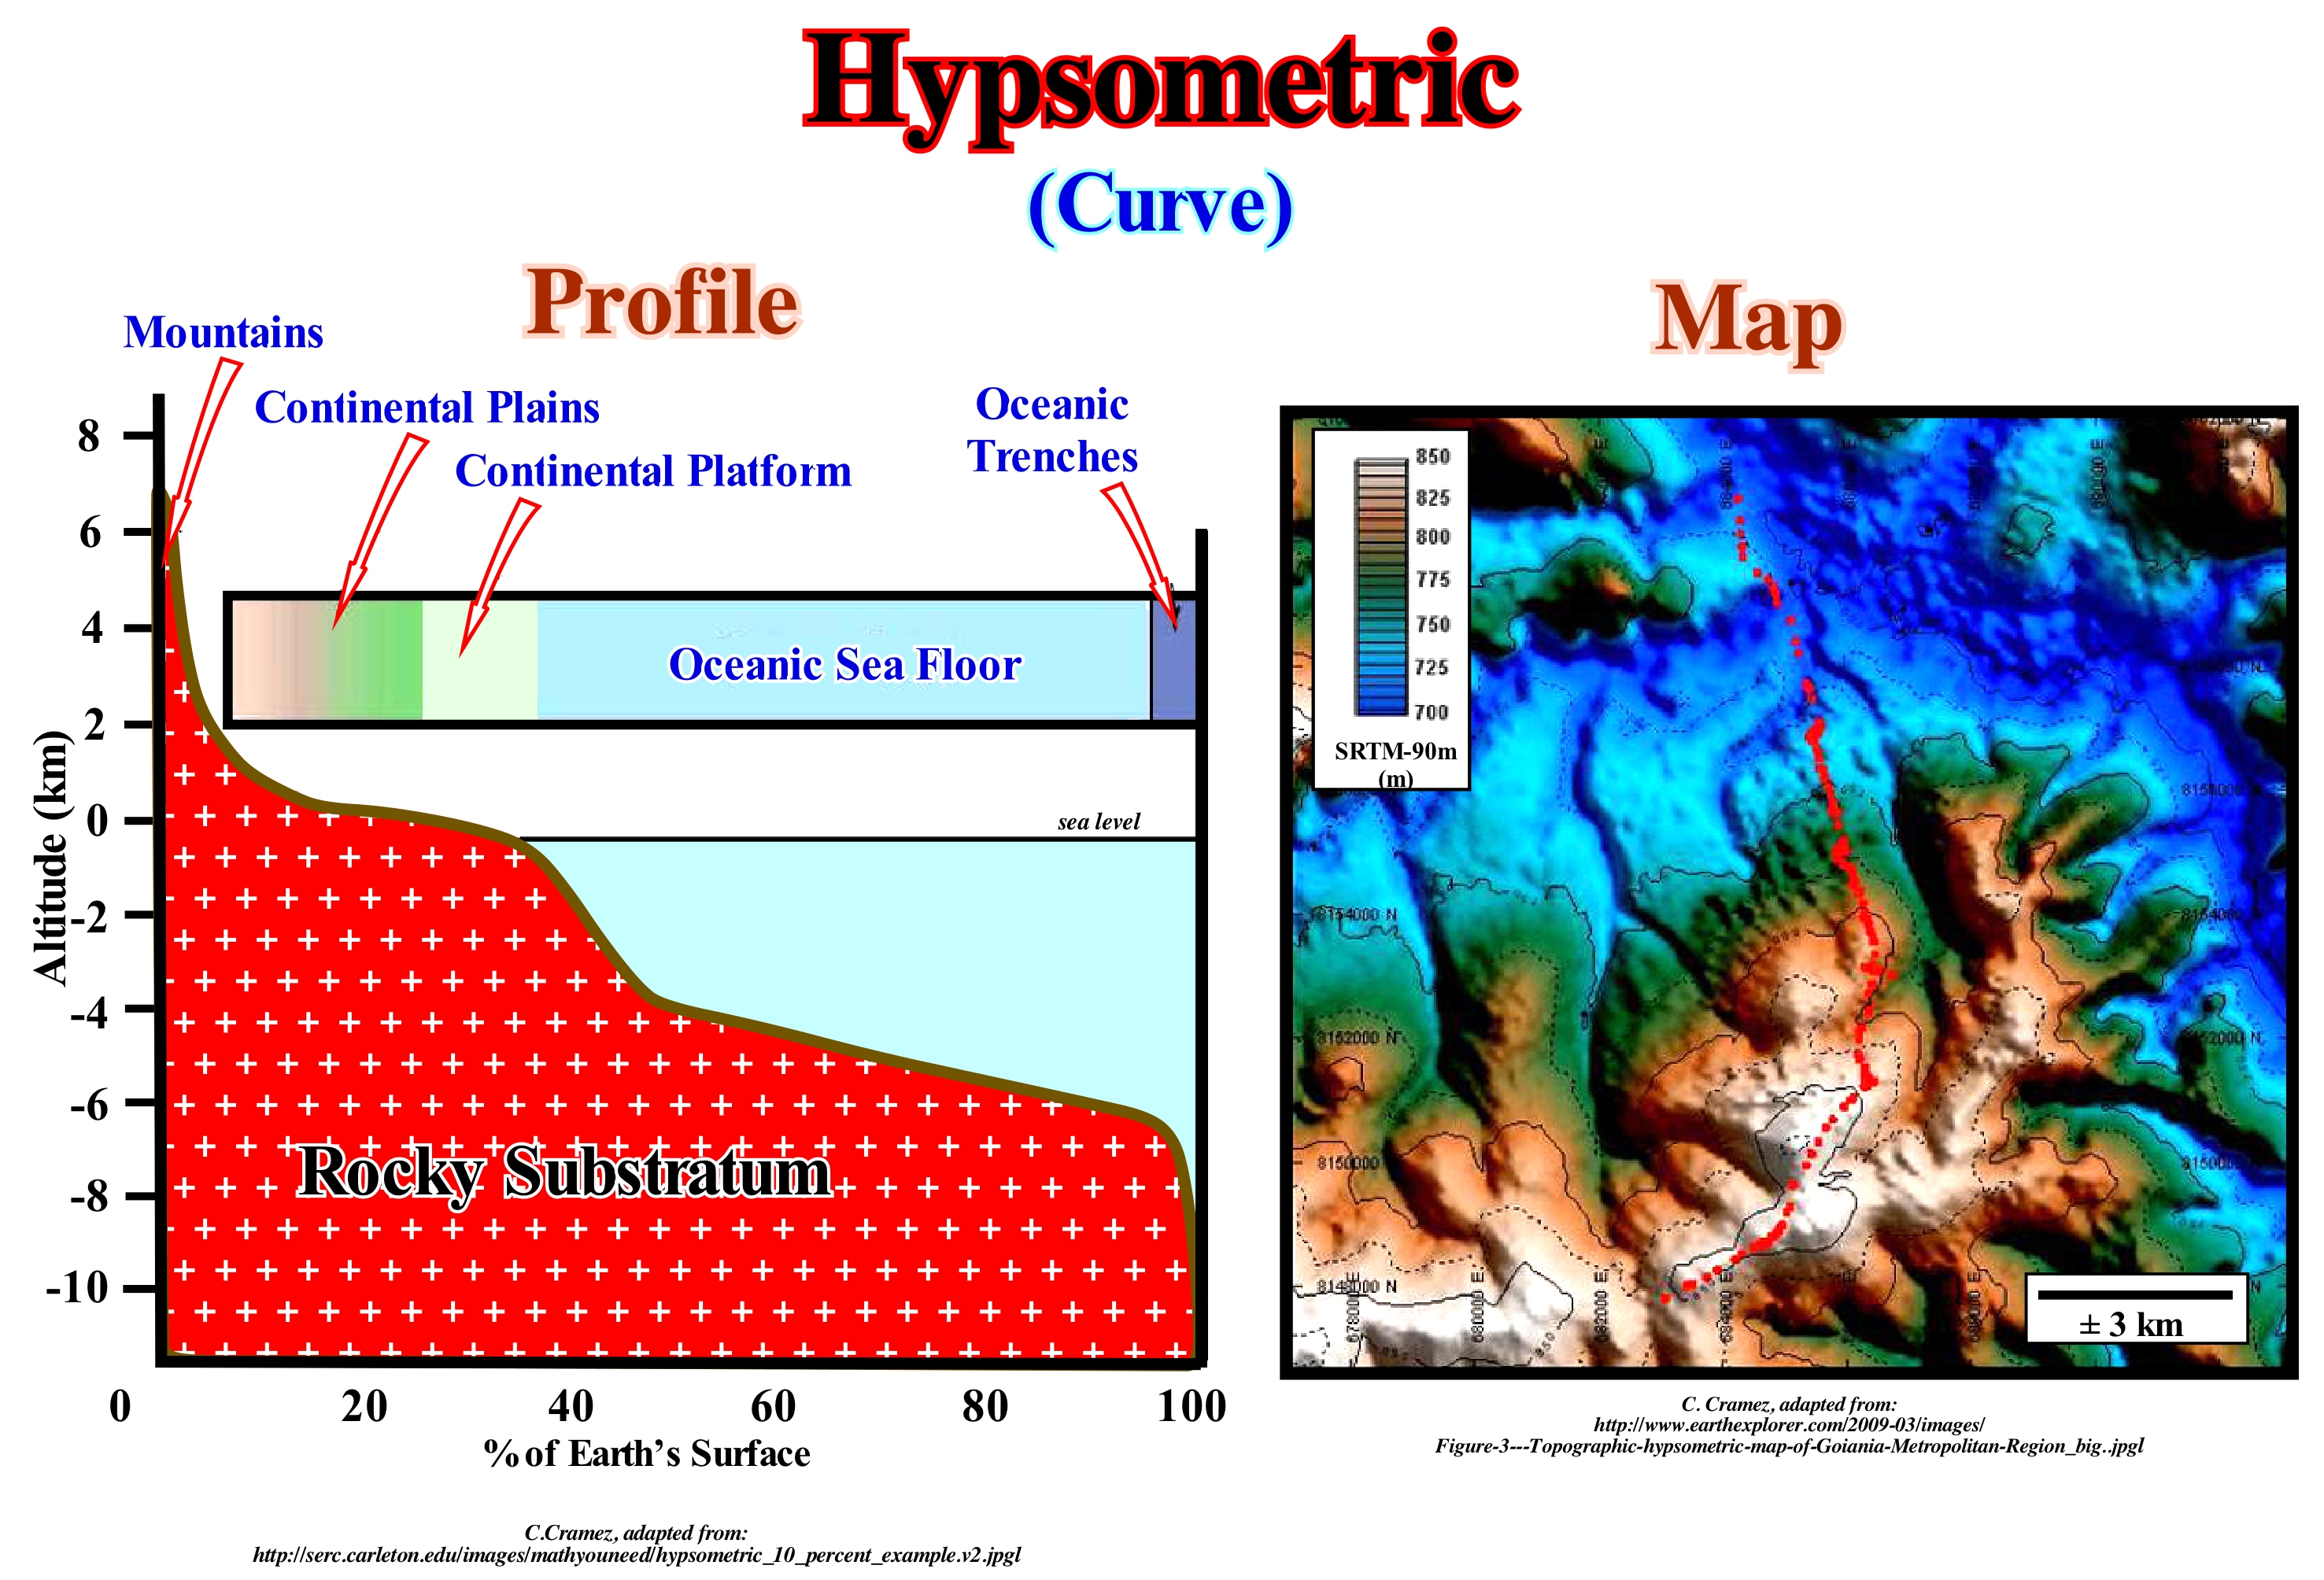
Do not confuse a hypsometric chart, such as the map illustrated on the right of this figure (which is a topographical map) with the hypsometric curve shown on the left. A hypsometric curve is an empirical function of the cumulative distribution of elevations of a region. The differences between the hypsometric curves of certain areas suggest they were shaped by different geomorphological processes. This is, often readily, recognized by the analysis of the drainage system, i.e., by the pattern formed by the water-courses, rivers and lakes of a certain region. The drainage systems (dendritic drainage, parallel, rectangular, radial, etc.) translate rock structures and different geomorphological processes. A hypsometric curve can also be considered as a continuous function and represented graphically as a projection x-y, in which the elevation is on the vertical axis (y-axis) and the area in the horizontal x-axis. A hypsometric curve can also be represented in a nondimensional way or in a standardized form by the maximum elevation and area values, which gives geoscientists a way to assess the similarity of the hydrographic basins. In other terms, a hypsometric curve (or hypsographic curve, as certain geoscientists call it) is a cumulative frequency curve of the height of the Earth's surface. Essentially, it is a graph that shows the proportion of land area that exists at various levels projecting relative area versus relative height. In the hypsometric curve of the total terrestrial surface there are two frequency maxima at 100 and 4,700 meters in height: they correspond to the average level of the continental areas and the sea floor. A hypsometric curve is, usually, used to demonstrate that the Earth has two types of crust: (i) Continental and (ii) Oceanic. The curve, as shown above, shows the percentage of the Earth's surface above any elevation. This is why the horizontal axis is called "% of the Earth's surface", since it indicates the percentage, while the vertical axis underlines elevation above or below sea level.
Hypsometric Profile...................................................................................................................................................................Profil hypsométrique
Perfil hipsométrico / Perfil hipsométrico/ Hypsometrisches Profil/ 分层设色曲线, , Hypsometric配置文件 / Гипсометрический профиль/ Profilo ipsometrica /
A curve that describes the morphology of the Earth's surface relative to a plane of reference, usually, the mean sea level that corresponds roughly to the Earth's geoid.
See: « Eustasy »
&
« Geoid »
&
« Geodetic Sea Level, Ocean Geoid »
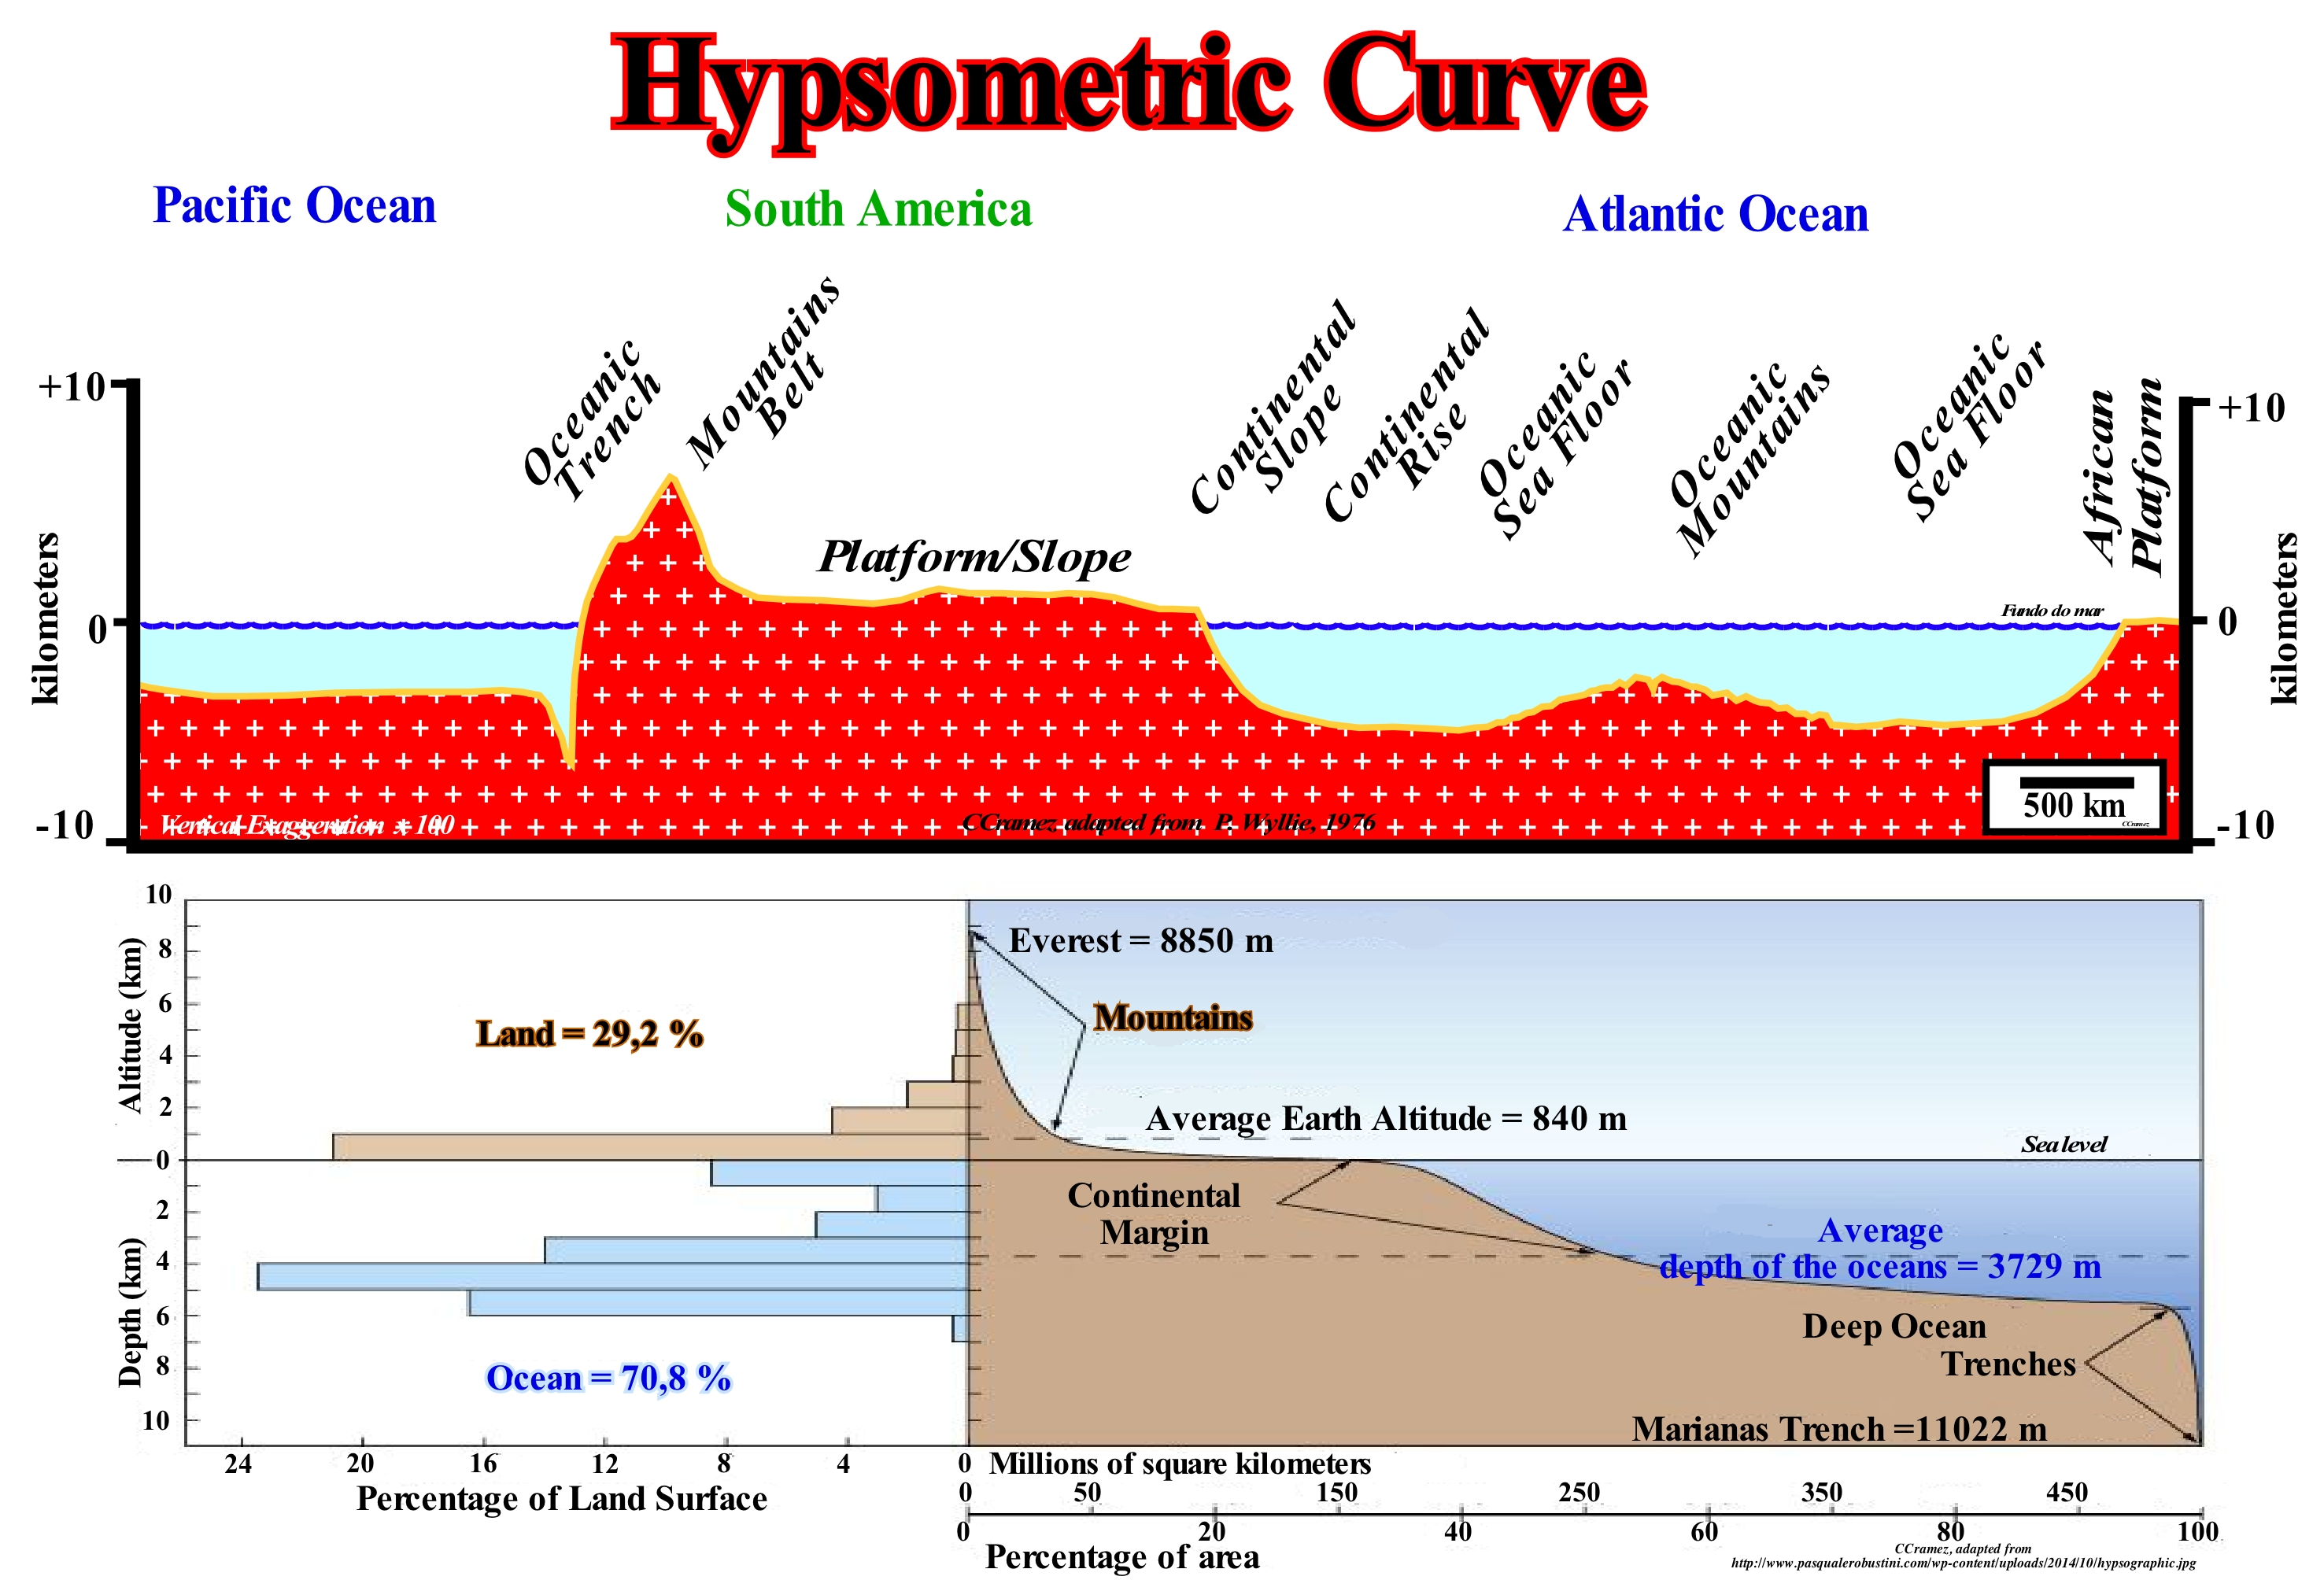
On this hypsometric section, between the Pacific Ocean and the African Platform, the three most important physiographic elements are: (i) The continental platforms (South and West Africa) ; (ii) The floors of the oceanic basins (South Atlantic and Pacific) and (iii) The submarine mountains (ocean ridges). The boundary between the platform and the ocean floor is the continental slope (including the continental rise), which descends abruptly from the continental edge to the ocean floor (slope varies from 3° to 6°). Contrary to popular belief, the most important mountain chain, represented in the hypsometric profile by the oceanic mountains between South America and Africa, is the mid-oceanic ridge (also called the submarine dorsal, dorsal meso-oceanic or middle ocean crest), which is situated on the ocean floor. It is different from the continental chains not only because it is formed, almost exclusively, by basalts, but also by the total absence of compressional deformations (shortenings). The mid-oceanic ridge extends over 65,000 km, with a variable width, whose average is about 1,000 km. This section allows to understand the structure of the divergent and convergent continental margins. In the divergent continental margins, there is oceanic expansion (sea floor spreading) and the formation of submarine volcanic mountains, which creates an oceanic bottom on each side, between the oceanic mountains and the continental rise (borderline of the continental margin, between the abyssal plain and the slope of the continental shelf, with crustal oceanic basement). The divergent continental margins are formed during the oceanic expansion that follows the breakup of the lithosphere of a supercontinent, in this case the small supercontinent Gondwana. In the first phase, the lithosphere of the supercontinent is lengthened by an extensive tectonic regime (σ1 vertical) with formation of half-grabens structures, which are filled by non-marine sediments, forming what the geoscientists call rift-type basins. After the break-up of the lithosphere of the supercontinent, the sedimentary wedges, which form the divergent margins, gradually, deposit on the rift-type basins, which predate the break-up of the lithosphere, as the ocean between the two margins is lengthened. Conversely, on the convergent continental margins, there is a reduction of the ocean floor. The oldest and densest oceanic crust plunges under the continental crust and enters the asthenosphere along a B-type subduction zones, where it is, partially, digested. The subduction zones are underlined in the hypsometric profiles by deep ocean trenches, such as the oceanic trenches that borders, in the west, South America. In the diagram below, it can be seen that: (a) The average height of the Earth is about of 840 meters ; (b) The average depth of the oceans is about 3,729 meters ; (c) The difference in terrestrial relief is about 20 km ; It corresponds to the difference between the Everest peak (more or less 8,850 meters) and the Mariana trench (about -11,022 meters), which is the deepest site of the oceans in the convergent margin between the lithospheric plate of the Pacific and the Philippines; (d) Oceans occupy about 70.8% of the land surface, 24% of which is under a water-depth between 4,000 and 5,000 meters and only 8% under a water depth of less than 1000 meters ; (e) Continents occupy about 29,2% of the terrestrial surface being 22% with an altitude of less than 1,000 meters. The distribution of water on Earth is as follows: (i) Oceans, 1,350 x 1015 m3 (97.3% of the total water) ; (ii) Cryosphere, 29 x 1015 m3 (2.1%) ; (iii) Underground, 8.4 x 10¹⁵ m3 (0.6%) ; (iv) Lakes and Rivers, 0.2 x 10¹⁵ m3 (0.01%) ; (v) Atmosphere, 0.013 x 10¹⁵ m3 (0.001%) and (vi) Biosphere, 0.0006 x 10¹⁵ m3 (4 x 10 -5%). In other words, about 97% of the Earth's water is salty. The fresh-water (3% of the total water of the Earth), only 32% is not frozen (groundwater about 30% and surface water about 2%). The Earth is wider around the equator than between the North and South Pole. It is similar to an ellipsoid or spheroid. The Earth's ellipsoid is a rough mathematical figure of Earth's shape, used as a frame of reference for geodetic, astronomical, and Geosciences computations. The geoid is the surface that is complex to describe, mathematically, but which can be easily identified by measuring gravity. The geoid is considered to be roughly equal to the Middle Sea Level*, but in the oceans, the Geoid and the Middle Level of the Absolute Sea are approximately coincident, but in continental areas they may be very different. The terrain (true shape of the Earth) is given by topography and bathymetry.
(*) An average whether it is sea level or temperature, to have meaning it must cover a rather long period. The World Meteorological Organization (WMO) recommends that it covers 30 years: from there one can speak of « normal ».


Send E-mails to carloscramez@gmail.com or to carlos.cramez@bluewin.ch with comments and suggestions to improve this glossary.
Copyright © 2009 CCramez, Switzerland
Last updated: August, 2019